ECMWF AIFS Single forecast, virtual validation report
This dataset validation report plots a sample of values from the ECMWF AIFS Single forecast, virtual dataset over time and across space, comparing where possible to a previously validated reference dataset. It also reports the quantity of unavailable values and their associated timestamps. These analyses are one layer of a multi-layered dataset validation process we perform at dynamical.org and also provide users a preview of the dataset contents.
Report generation start time: 2026-09-17T16:48:39 UTC
Summary
This dataset has been reviewed and is ready for use.
One thing is worth knowing before you use the data, detailed in review notes below: soil moisture and runoff report water points differently before and after 12 May 2026.
What looks good
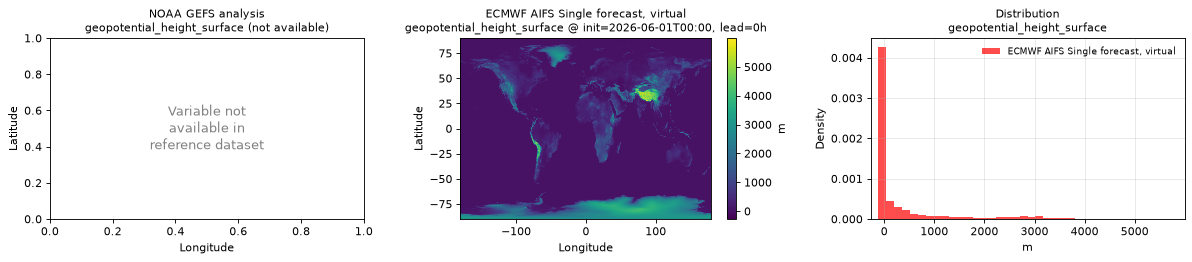
- Geometry, orientation and coordinates are correct in every variable — north-up, −180° to +180° with no discontinuity at the map centre, coastlines and terrain features at their true positions, across the full 721 × 1440 global grid. The fixed orography fields place the Himalaya, Andes, Rockies, Greenland and the Antarctic plateau exactly where they belong, down to the Ellsworth Mountains.
- Units and value ranges are physically plausible for all thirty-five variables, including temperatures in degrees Celsius, cloud cover in percent, and pressures in pascals.
- Physically linked variables agree with each other. Total cloud cover is greater than or equal to every individual cloud layer; dew point stays below air temperature; convective precipitation never exceeds total precipitation; surface pressure sits below mean-sea-level pressure over high terrain and equals it over the ocean; and the accumulated fields increase steadily through each forecast from zero.
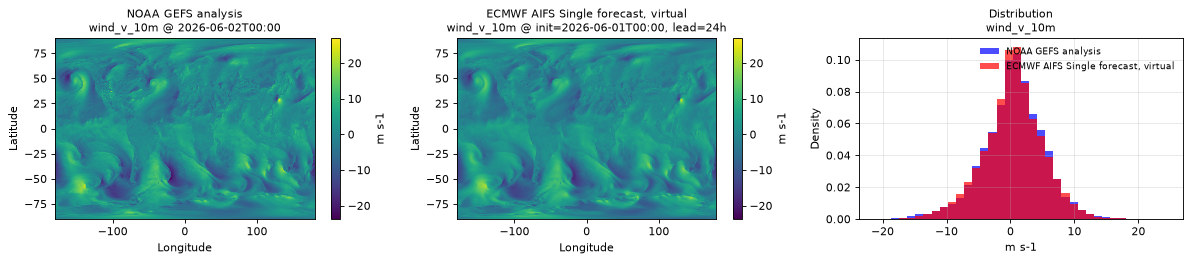
- The data agrees with an independent reference. For the variables also carried by the NOAA GEFS analysis dataset, value distributions overlap closely and maps agree.
- No numerical banding, stair-stepping, stuck values, placeholder values or unit jumps appear in any map or time series.
- Availability is complete apart from the one forecast listed below: 3,597 of the 3,598 forecasts in the archive have all sixty-one of their forecast steps.
- Every sampled reference decoded. The decode-health check read 2,521 references spread across twenty forecasts, five forecast steps and three pressure levels, and none failed.
- Values run smoothly through November 2024 to February 2025, the months whose forecasts are read from ECMWF's copy on Amazon Web Services rather than its copy on Google Cloud, with no step, spike or flat segment against the months either side.
Review notes
- Forecast 2025-01-21T06:00 is missing four of its sixty-one steps: hours 0, 12, 192 and 270. Neither of ECMWF's public copies of the open data has complete files for them. Every other forecast in the archive has all of its source files.
- Water points in soil moisture and runoff changed from zero to missing at forecast 2026-05-12T06:00. Before that forecast,
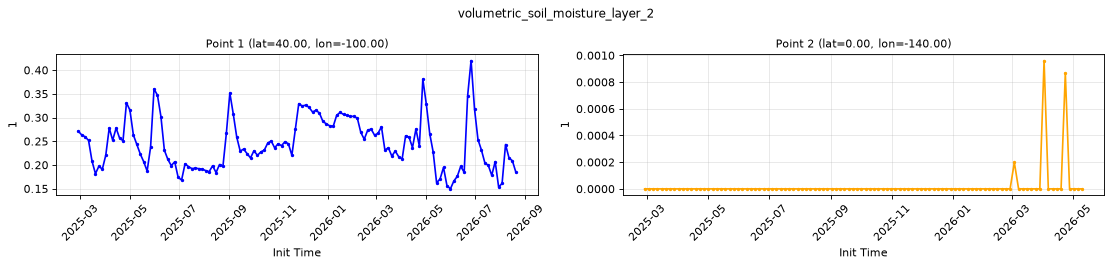
volumetric_soil_moisture_layer_1,volumetric_soil_moisture_layer_2andrunoff_water_equivalent_run_total_surfacereport values over water, almost all of them zero; from it, they report missing (NaN) on 64.0% of grid cells. - Variable additions. ECMWF added variables to the archive over time.
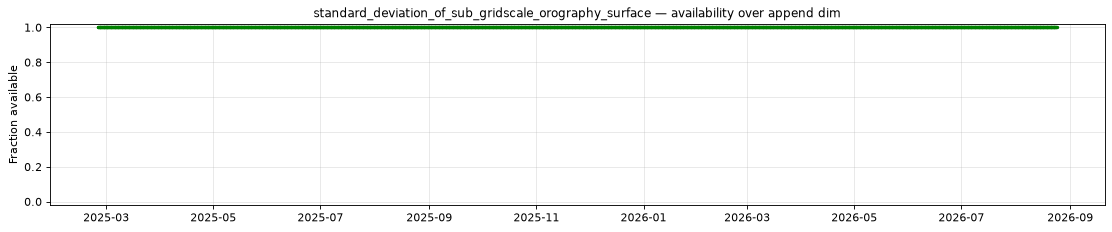
- 2025-02-24T06:00:
wind_u_100m,wind_v_100m,total_cloud_cover_atmosphere,low_cloud_cover,medium_cloud_cover,high_cloud_cover,total_precipitation_run_total_surface,convective_precipitation_run_total_surface,downward_short_wave_radiation_run_total_surface,downward_long_wave_radiation_run_total_surface,snowfall_water_equivalent_run_total_surface,runoff_water_equivalent_run_total_surface,soil_temperature_layer_1,soil_temperature_layer_2,volumetric_soil_moisture_layer_1,volumetric_soil_moisture_layer_2,slope_of_sub_gridscale_orography_surface,standard_deviation_of_sub_gridscale_orography_surface. - 2026-05-12T06:00: the 10 hPa pressure level, for every
pressure_levelvariable exceptspecific_humidity. - 2026-05-13T00:00:
snow_area_fraction_surface.
- 2025-02-24T06:00:
Datasets
| Role | Name | ID | Version | URL |
|---|---|---|---|---|
| Validation | ECMWF AIFS Single forecast, virtual | ecmwf-aifs-single-forecast-virtual |
v0.2.0 |
s3://dynamical-ecmwf-aifs-single/ecmwf-aifs-single-forecast-virtual/v0.2.0.icechunk |
| Reference | NOAA GEFS analysis | noaa-gefs-analysis |
0.1.2 |
s3://dynamical-noaa-gefs/noaa-gefs-analysis/v0.1.2.icechunk/ |
Run parameters
| Parameter | Value |
|---|---|
| Validation dataset type | forecast |
| Validation time range | init_time 2024-04-01T00:00 → 2026-09-17T06:00 |
| Reference time range | time 2000-01-01T00:00 → 2026-09-17T12:00 |
| Point 1 | lat=40.0000, lon=-100.0000 |
| Point 2 | lat=0.0000, lon=-140.0000 |
| Spatial comparison time | init=2026-06-01T00:00, lead=24h (reference at 2026-06-02T00:00) |
| Timeseries period | init=2026-06-01T00:00 |
| Vertical level | middle level per vertical dim |
| Store type | virtual — availability manifest-probed; value series sampled |
Availability
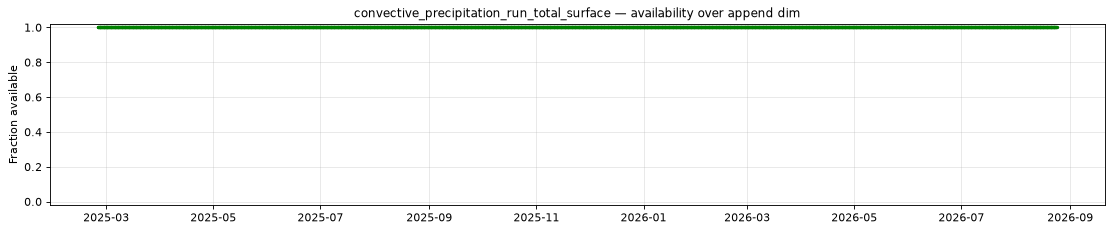
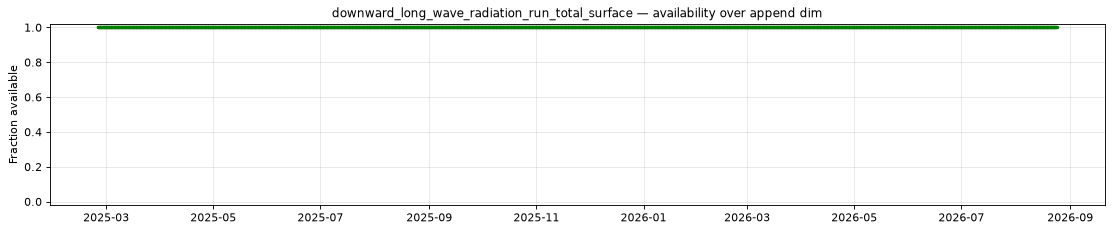
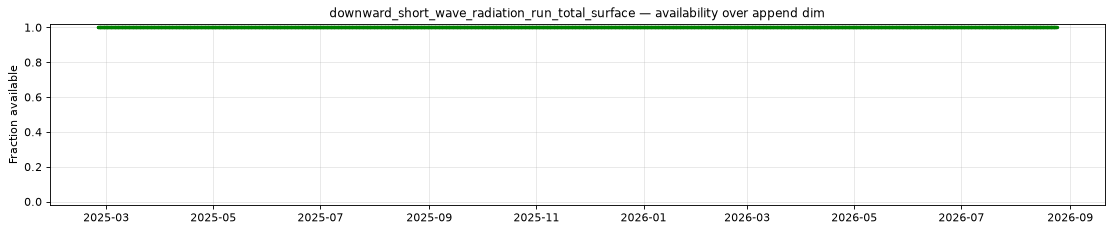
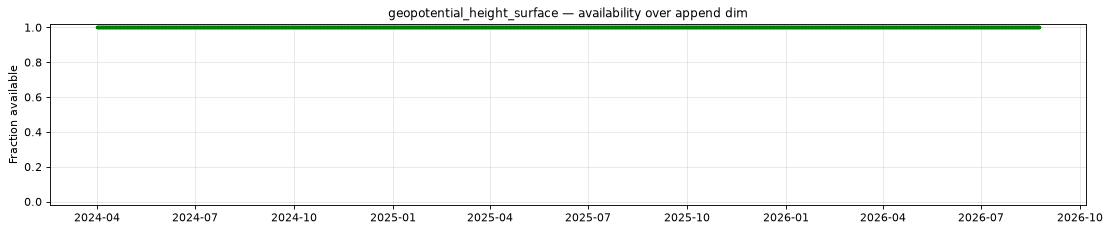
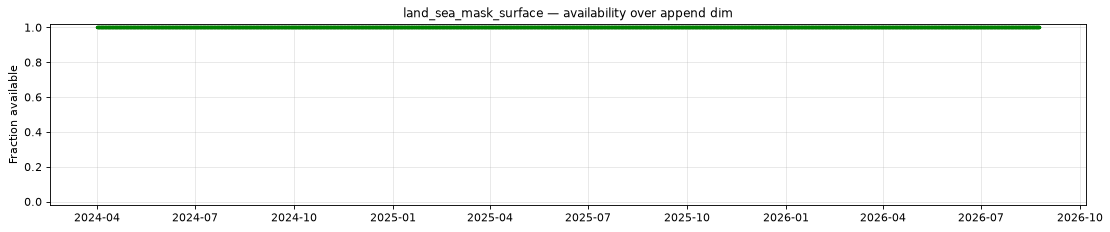
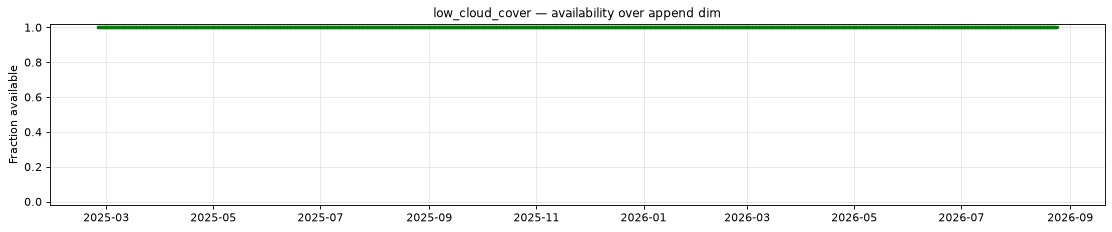
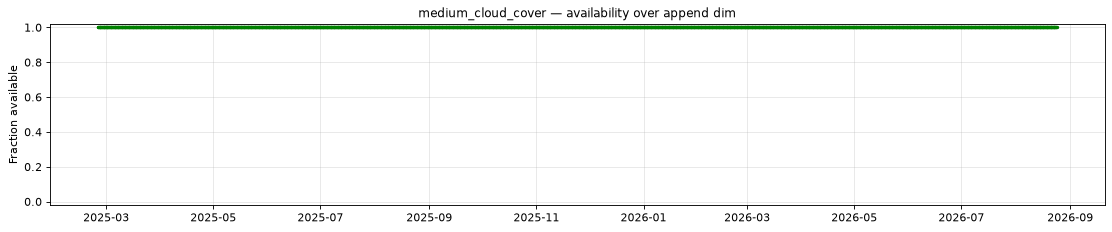
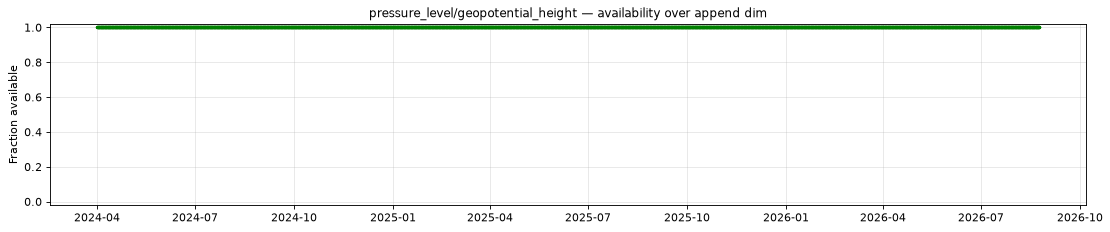
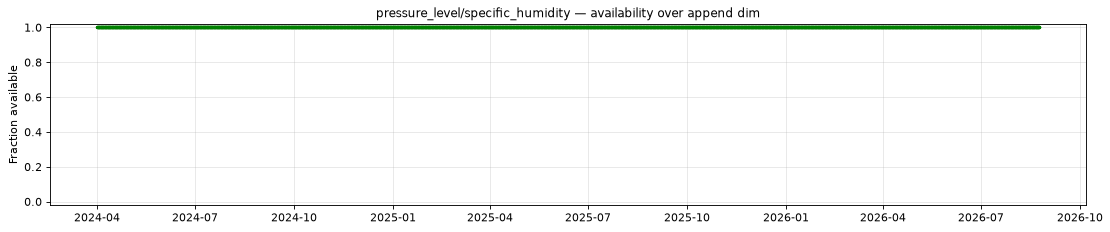
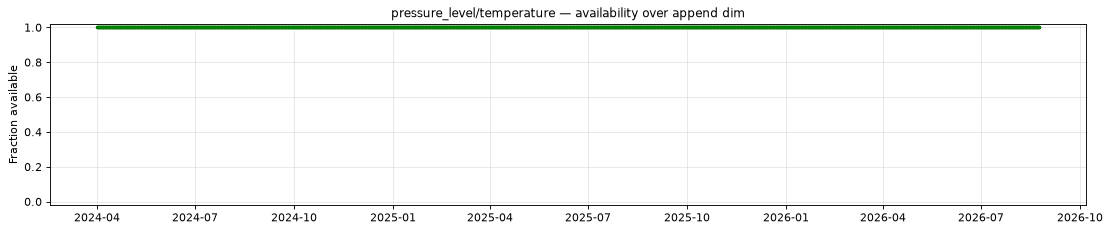
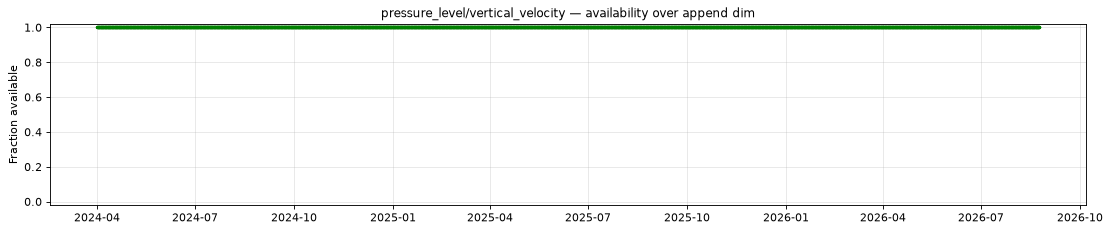
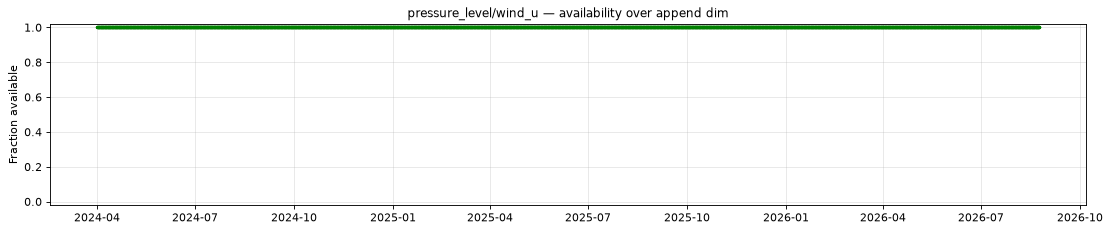
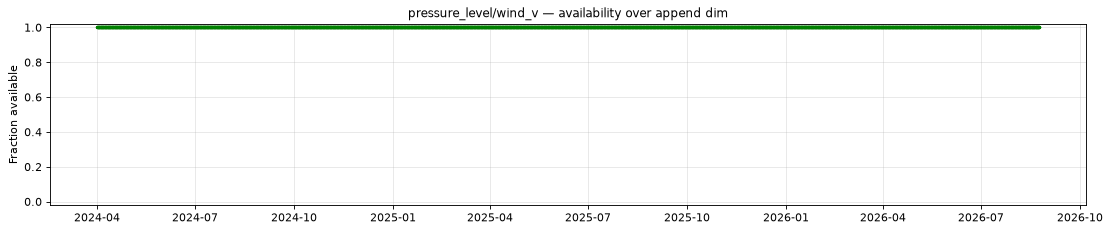
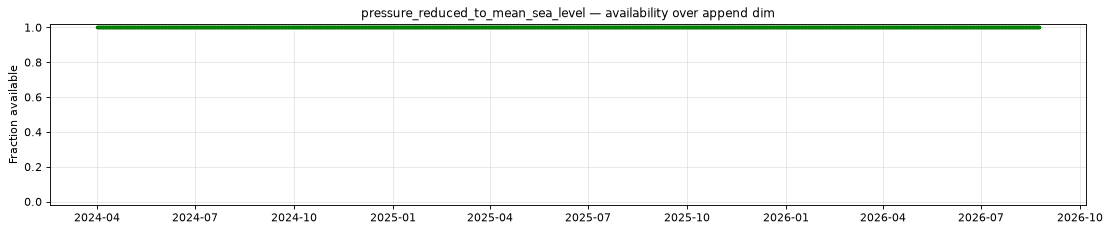
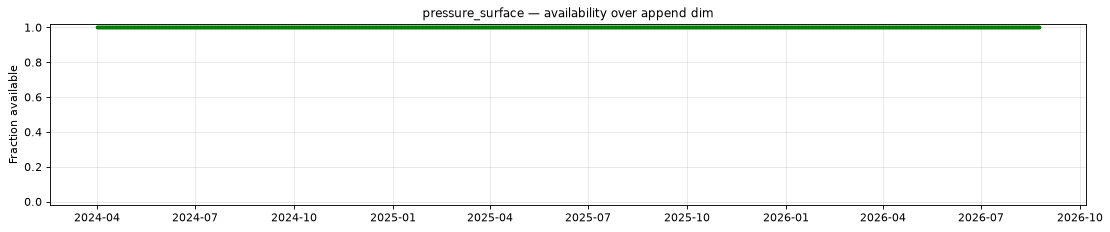
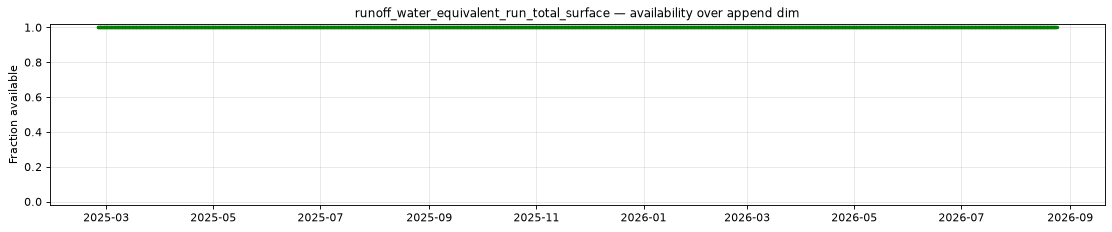
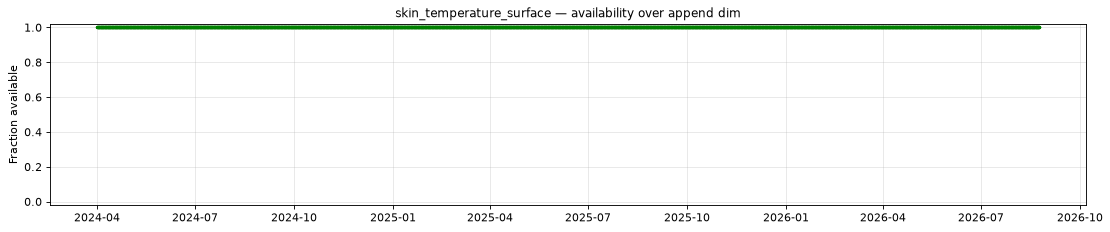
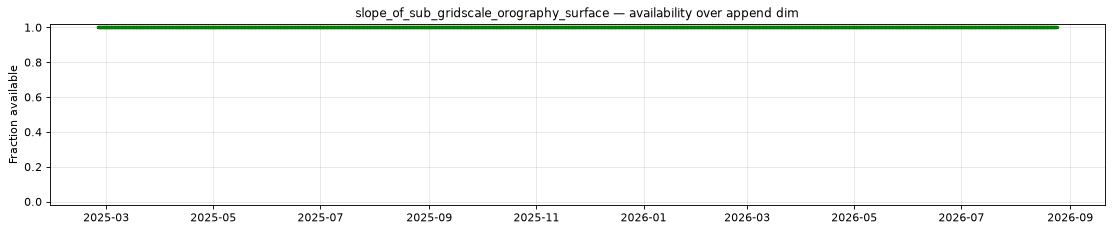
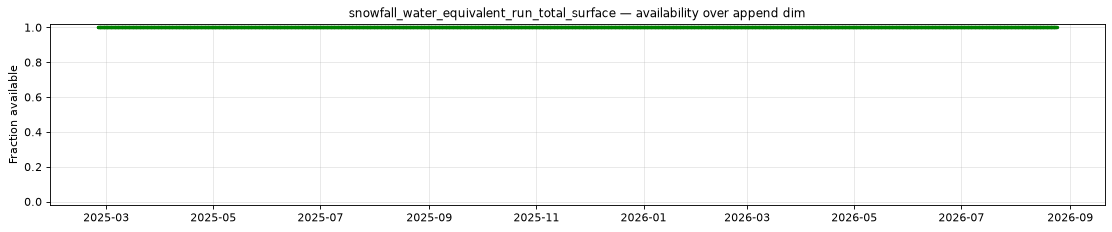
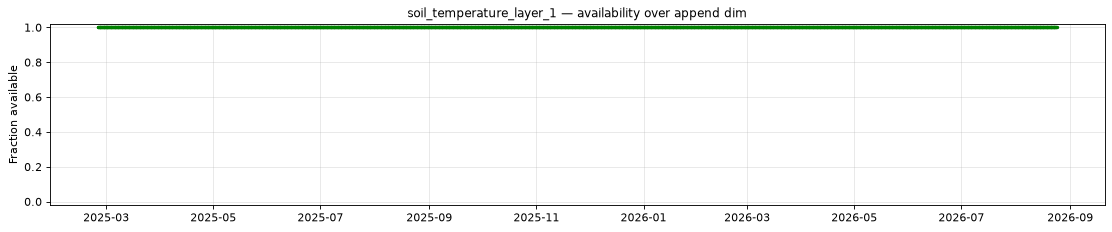
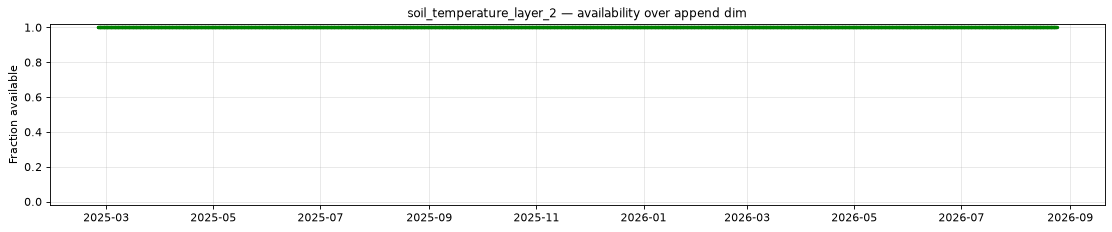
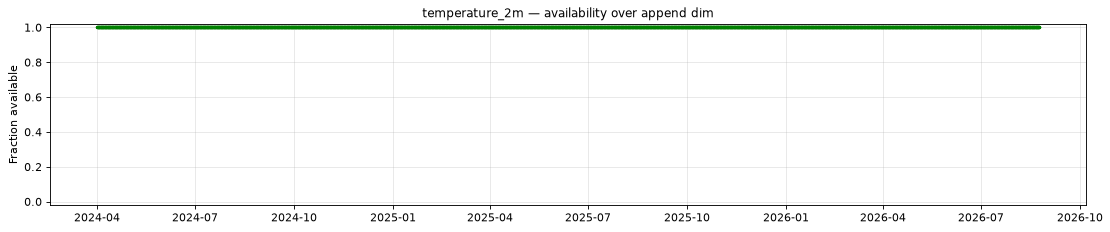
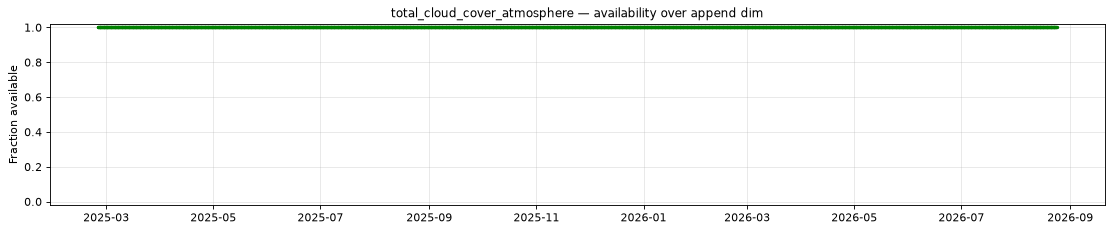
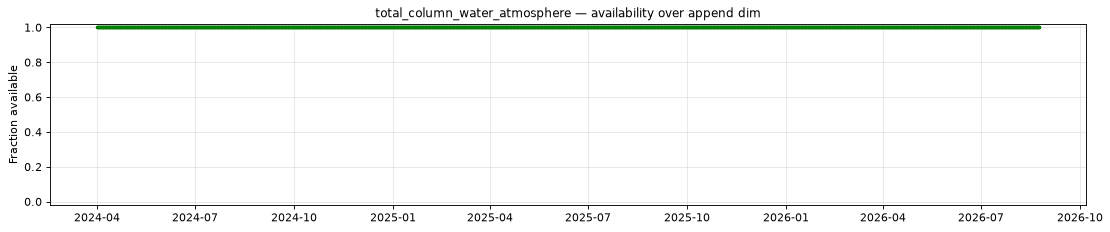
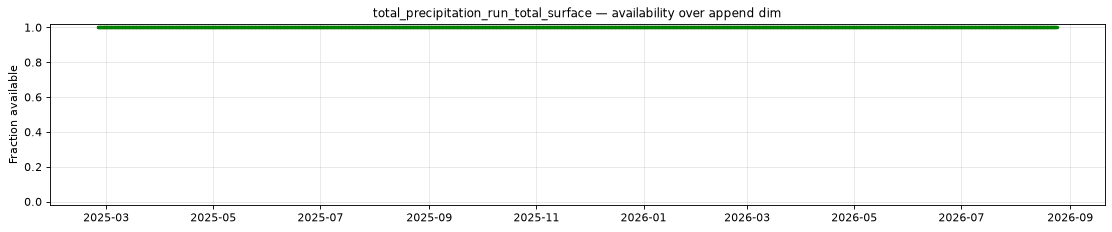
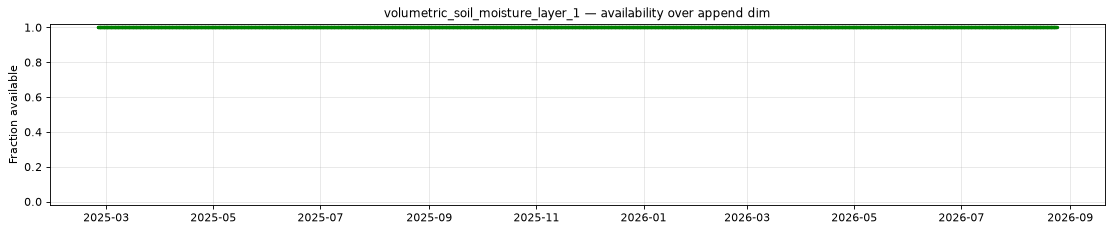
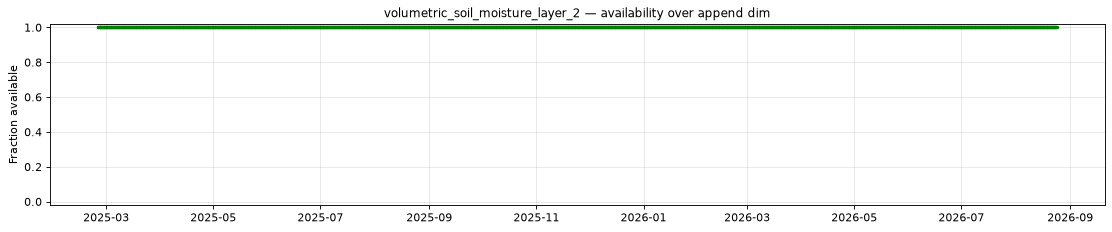
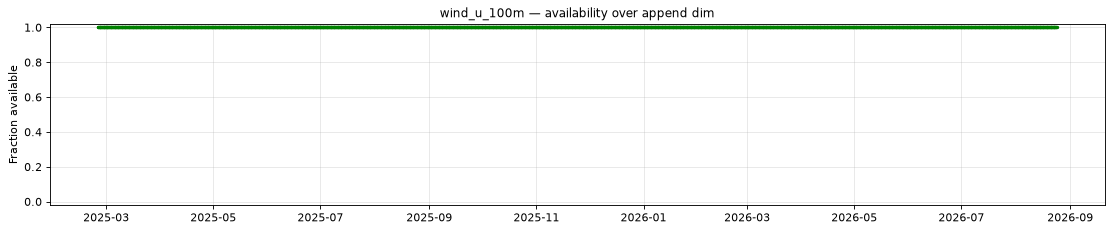
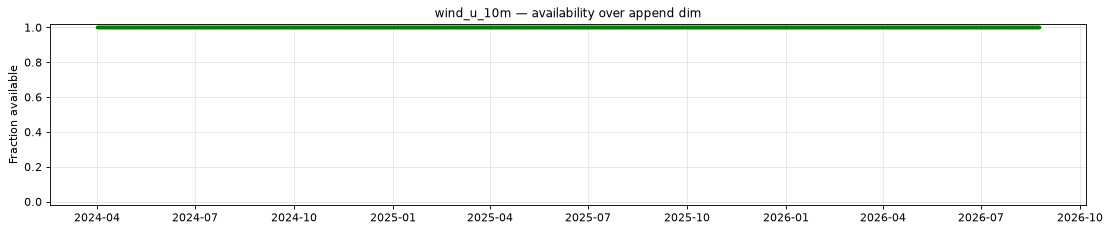
The plot below shows the availability of each variable over time — light red marks unavailable data, dark green marks present data.
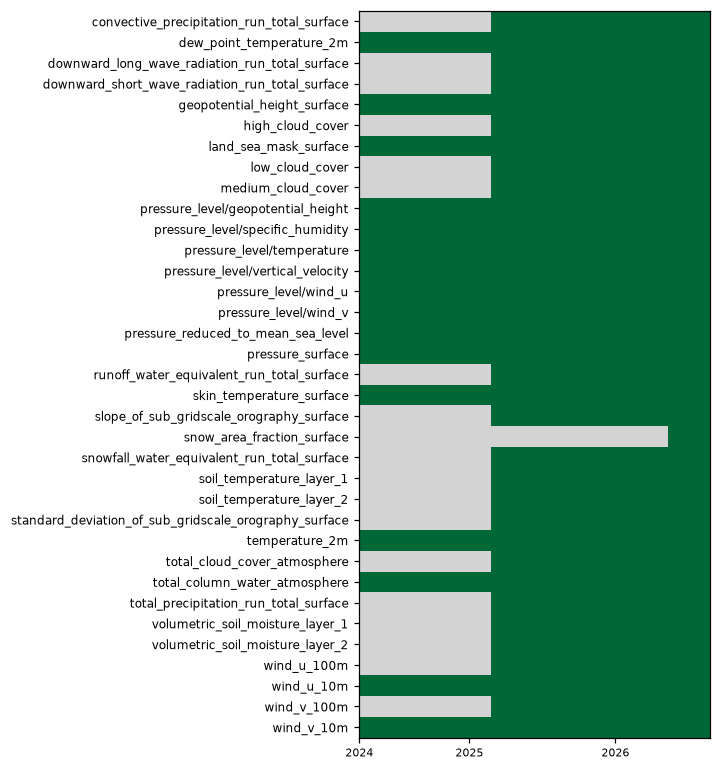
| Variable | Complete positions | Incomplete % | First incomplete | Last incomplete |
|---|---|---|---|---|
convective_precipitation_run_total_surface |
2281/3598 | 36.60% | 2024-04-01T00:00 | 2025-02-24T00:00 |
downward_long_wave_radiation_run_total_surface |
2281/3598 | 36.60% | 2024-04-01T00:00 | 2025-02-24T00:00 |
downward_short_wave_radiation_run_total_surface |
2281/3598 | 36.60% | 2024-04-01T00:00 | 2025-02-24T00:00 |
geopotential_height_surface |
3597/3598 | 0.03% | 2025-01-21T06:00 | 2025-01-21T06:00 |
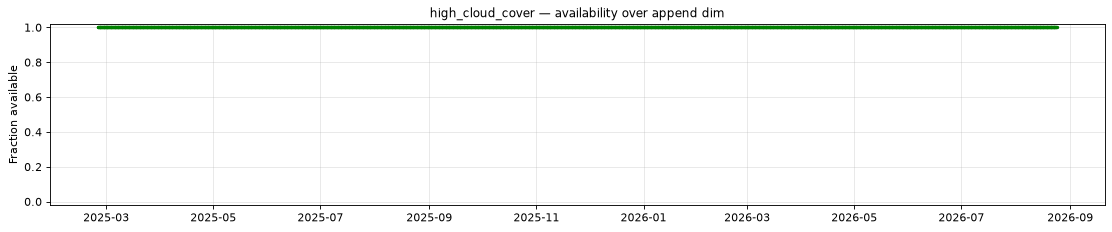
high_cloud_cover |
2281/3598 | 36.60% | 2024-04-01T00:00 | 2025-02-24T00:00 |
land_sea_mask_surface |
3597/3598 | 0.03% | 2025-01-21T06:00 | 2025-01-21T06:00 |
low_cloud_cover |
2281/3598 | 36.60% | 2024-04-01T00:00 | 2025-02-24T00:00 |
medium_cloud_cover |
2281/3598 | 36.60% | 2024-04-01T00:00 | 2025-02-24T00:00 |
runoff_water_equivalent_run_total_surface |
2281/3598 | 36.60% | 2024-04-01T00:00 | 2025-02-24T00:00 |
slope_of_sub_gridscale_orography_surface |
2281/3598 | 36.60% | 2024-04-01T00:00 | 2025-02-24T00:00 |
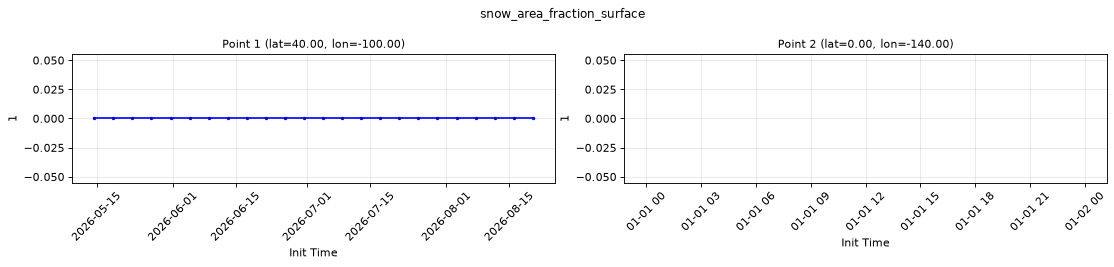
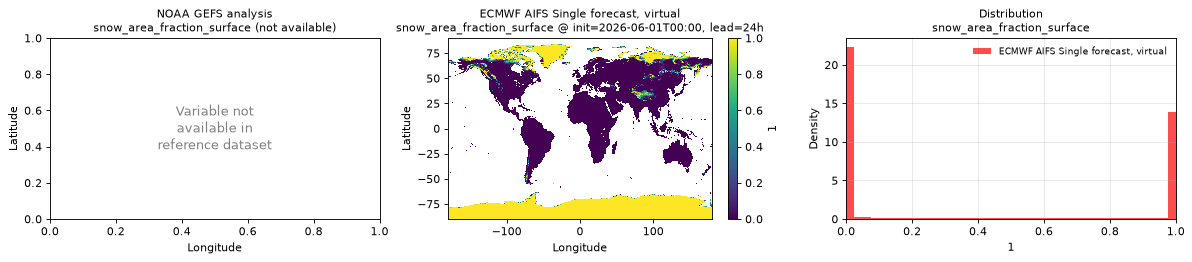
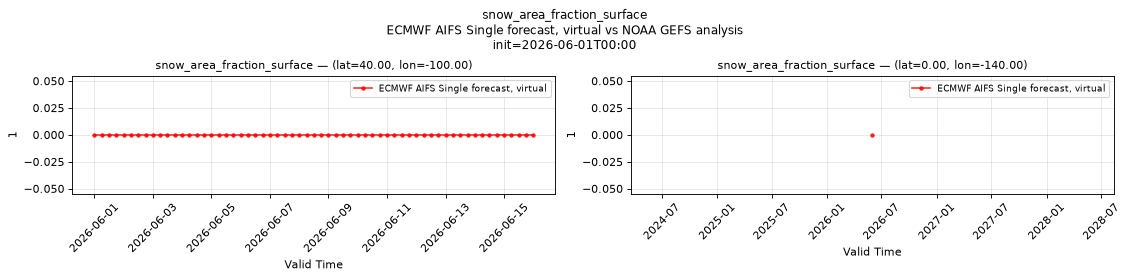
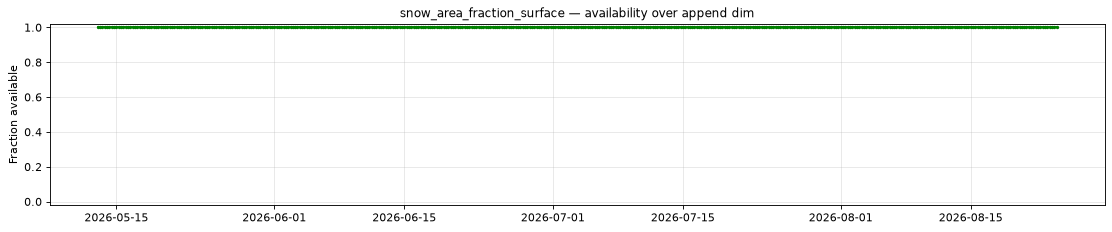
snow_area_fraction_surface |
510/3598 | 85.83% | 2024-04-01T00:00 | 2026-05-12T18:00 |
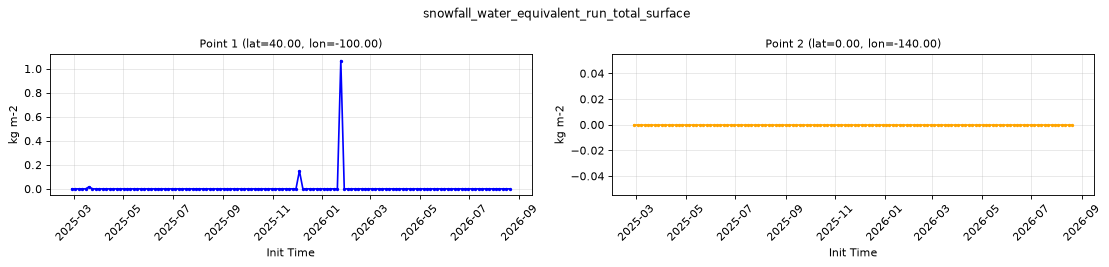
snowfall_water_equivalent_run_total_surface |
2281/3598 | 36.60% | 2024-04-01T00:00 | 2025-02-24T00:00 |
soil_temperature_layer_1 |
2281/3598 | 36.60% | 2024-04-01T00:00 | 2025-02-24T00:00 |
soil_temperature_layer_2 |
2281/3598 | 36.60% | 2024-04-01T00:00 | 2025-02-24T00:00 |
standard_deviation_of_sub_gridscale_orography_surface |
2281/3598 | 36.60% | 2024-04-01T00:00 | 2025-02-24T00:00 |
total_cloud_cover_atmosphere |
2281/3598 | 36.60% | 2024-04-01T00:00 | 2025-02-24T00:00 |
total_precipitation_run_total_surface |
2281/3598 | 36.60% | 2024-04-01T00:00 | 2025-02-24T00:00 |
volumetric_soil_moisture_layer_1 |
2281/3598 | 36.60% | 2024-04-01T00:00 | 2025-02-24T00:00 |
volumetric_soil_moisture_layer_2 |
2281/3598 | 36.60% | 2024-04-01T00:00 | 2025-02-24T00:00 |
wind_u_100m |
2281/3598 | 36.60% | 2024-04-01T00:00 | 2025-02-24T00:00 |
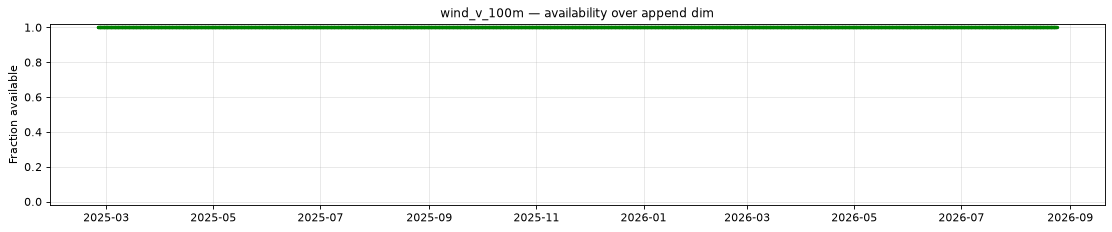
wind_v_100m |
2281/3598 | 36.60% | 2024-04-01T00:00 | 2025-02-24T00:00 |
- Unavailable timestamps:
unavailable_timestamps.txt
Decode health
2521 references decoded successfully, sampled across 20 of 3598 append-dim regions, 5 leads and 3 levels per group variable.
Per-variable details
convective_precipitation_run_total_surface
Metadata
| Field | Value |
|---|---|
| units | kg m-2 |
| long_name | Convective precipitation |
| short_name | cp |
| standard_name | convective_precipitation_amount |
| step_type | accum |
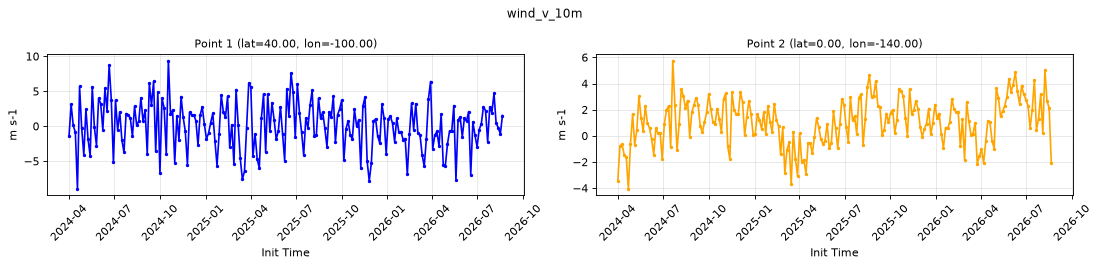
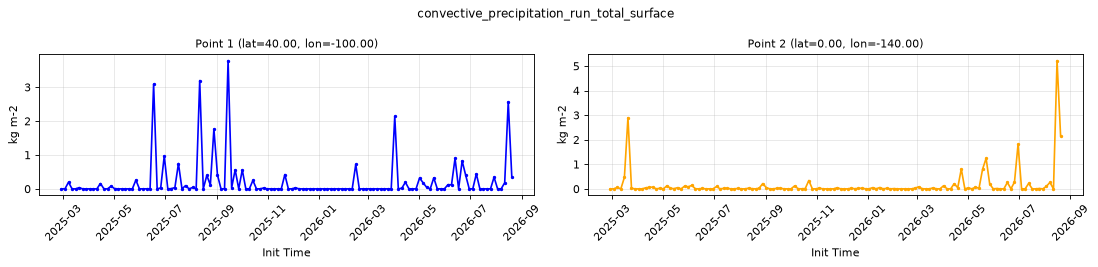
Point time series — 2024-04-01T00:00 - 2026-09-17T06:00, sampled lead=6h
| Point | min | mean | max |
|---|---|---|---|
| P1 | 0 | 0.2567 | 4.002 |
| P2 | 0 | 0.1799 | 5.22 |
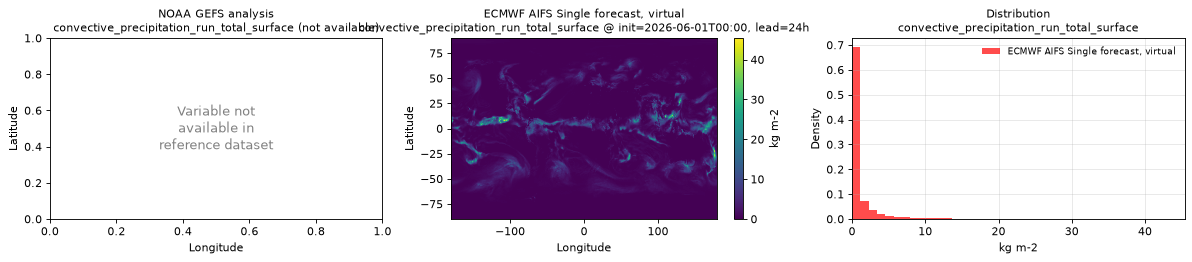
Spatial — init=2026-06-01T00:00, lead=24h (reference not available)
| Source | min | mean | max |
|---|---|---|---|
| Validation | 0 | 1.124 | 45.41 |
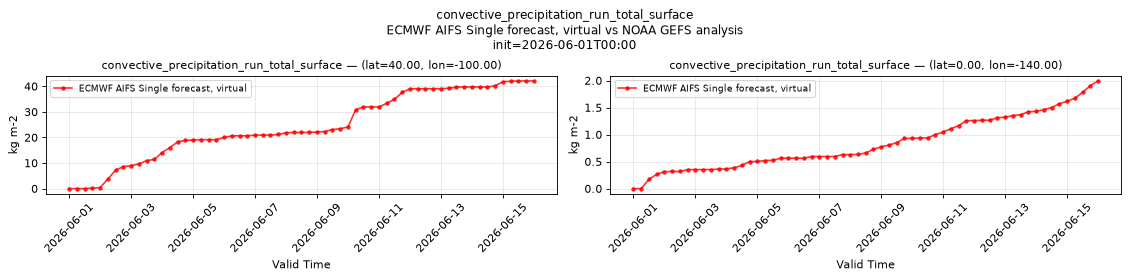
Temporal — init=2026-06-01T00:00
| Source | min | mean | max |
|---|---|---|---|
| P1 Validation | 0 | 24.41 | 42.09 |
| P2 Validation | 0 | 0.8444 | 1.992 |
Availability — 2281 of 3598 positions complete (incomplete 2024-04-01T00:00 → 2025-02-24T00:00)
dew_point_temperature_2m
Metadata
| Field | Value |
|---|---|
| units | degree_Celsius |
| long_name | 2 metre dewpoint temperature |
| short_name | 2d |
| standard_name | dew_point_temperature |
| step_type | instant |
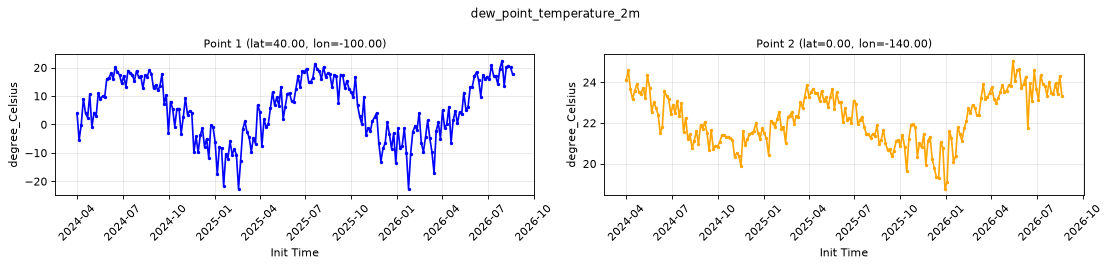
Point time series — 2024-04-01T00:00 - 2026-09-17T06:00, sampled lead=6h
| Point | min | mean | max |
|---|---|---|---|
| P1 | -22.65 | 5.875 | 22.49 |
| P2 | 18.76 | 22.26 | 25.07 |
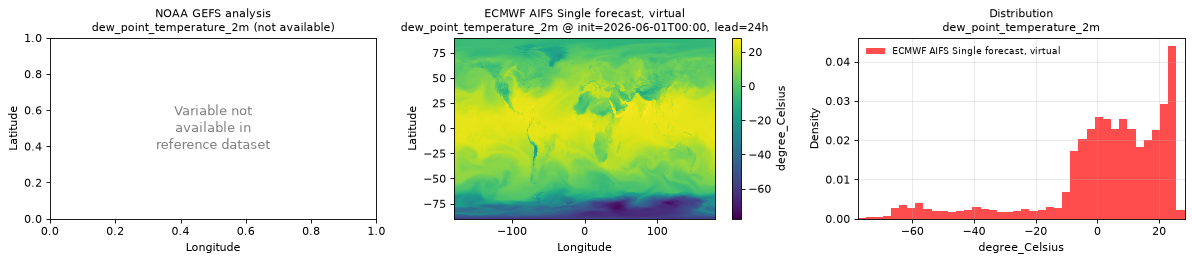
Spatial — init=2026-06-01T00:00, lead=24h (reference not available)
| Source | min | mean | max |
|---|---|---|---|
| Validation | -77.61 | 2.439 | 28.23 |
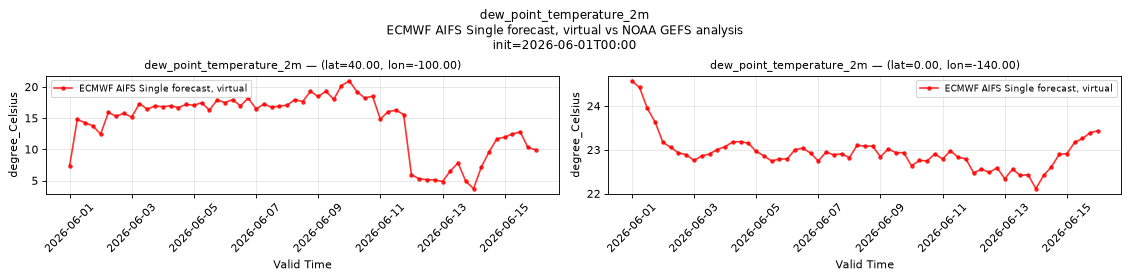
Temporal — init=2026-06-01T00:00
| Source | min | mean | max |
|---|---|---|---|
| P1 Validation | 3.707 | 14.3 | 20.95 |
| P2 Validation | 22.11 | 22.94 | 24.57 |
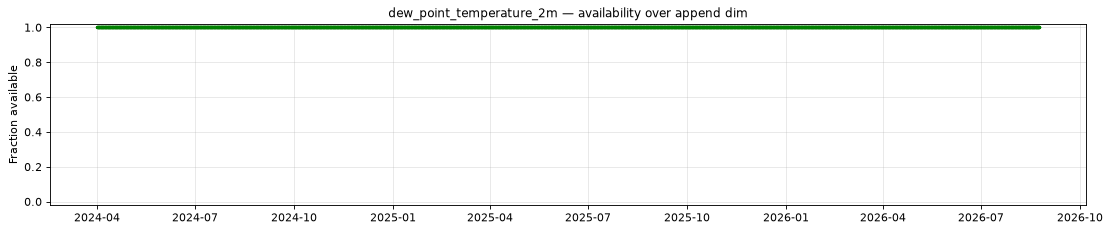
Availability — 3598 of 3598 positions complete
downward_long_wave_radiation_run_total_surface
Metadata
| Field | Value |
|---|---|
| units | W s m-2 |
| long_name | Surface long-wave (thermal) radiation downwards |
| short_name | strd |
| standard_name | integral_wrt_time_of_surface_downwelling_longwave_flux_in_air |
| step_type | accum |
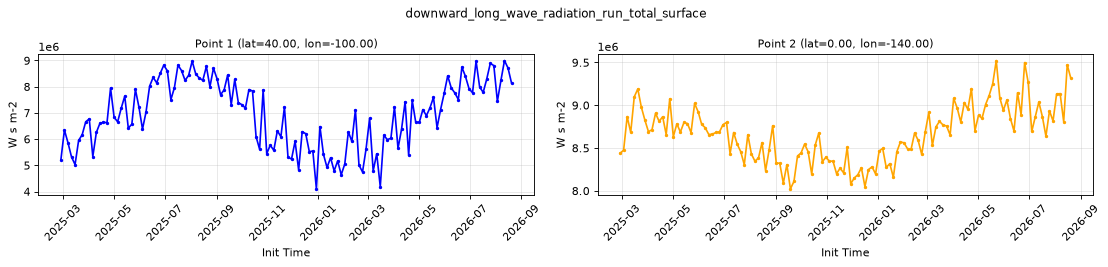
Point time series — 2024-04-01T00:00 - 2026-09-17T06:00, sampled lead=6h
| Point | min | mean | max |
|---|---|---|---|
| P1 | 4.102e+06 | 7.005e+06 | 9.053e+06 |
| P2 | 8.023e+06 | 8.69e+06 | 9.522e+06 |
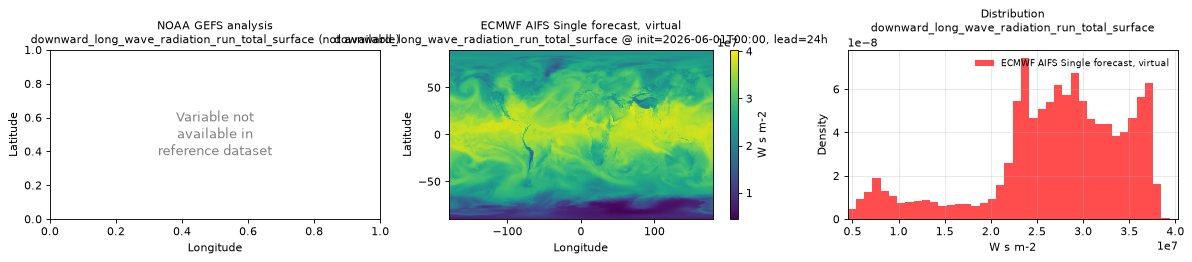
Spatial — init=2026-06-01T00:00, lead=24h (reference not available)
| Source | min | mean | max |
|---|---|---|---|
| Validation | 4.466e+06 | 2.699e+07 | 4.028e+07 |
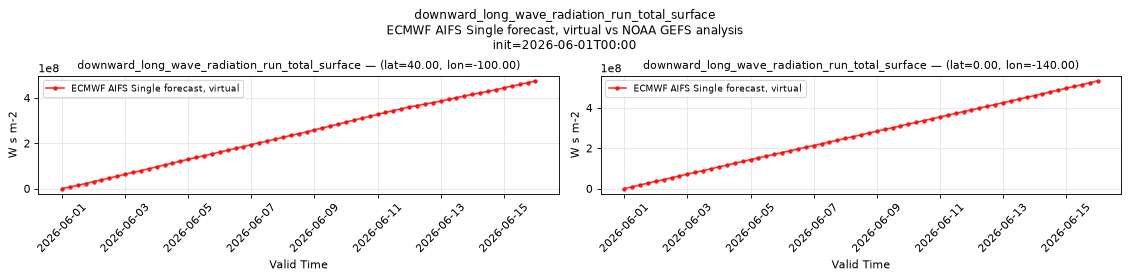
Temporal — init=2026-06-01T00:00
| Source | min | mean | max |
|---|---|---|---|
| P1 Validation | 0 | 2.413e+08 | 4.747e+08 |
| P2 Validation | 0 | 2.661e+08 | 5.325e+08 |
Availability — 2281 of 3598 positions complete (incomplete 2024-04-01T00:00 → 2025-02-24T00:00)
downward_short_wave_radiation_run_total_surface
Metadata
| Field | Value |
|---|---|
| units | W s m-2 |
| long_name | Surface short-wave (solar) radiation downwards |
| short_name | ssrd |
| standard_name | integral_wrt_time_of_surface_downwelling_shortwave_flux_in_air |
| step_type | accum |
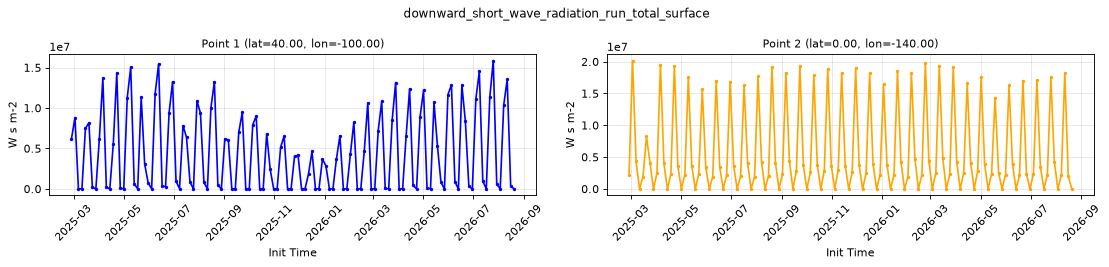
Point time series — 2024-04-01T00:00 - 2026-09-17T06:00, sampled lead=6h
| Point | min | mean | max |
|---|---|---|---|
| P1 | 0 | 4.576e+06 | 1.586e+07 |
| P2 | 0 | 5.976e+06 | 2.017e+07 |
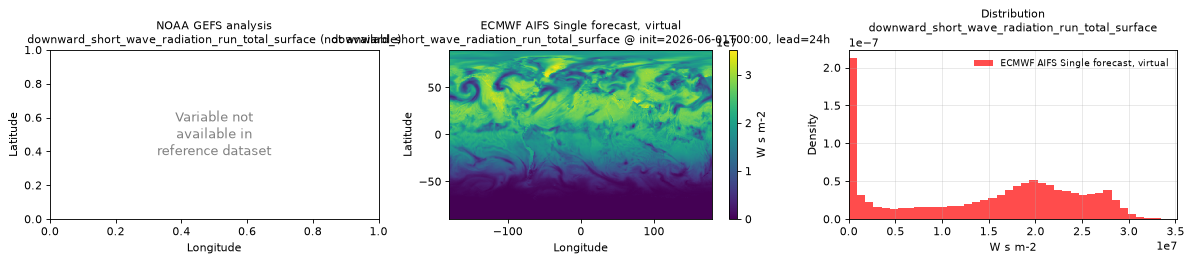
Spatial — init=2026-06-01T00:00, lead=24h (reference not available)
| Source | min | mean | max |
|---|---|---|---|
| Validation | 0 | 1.437e+07 | 3.52e+07 |
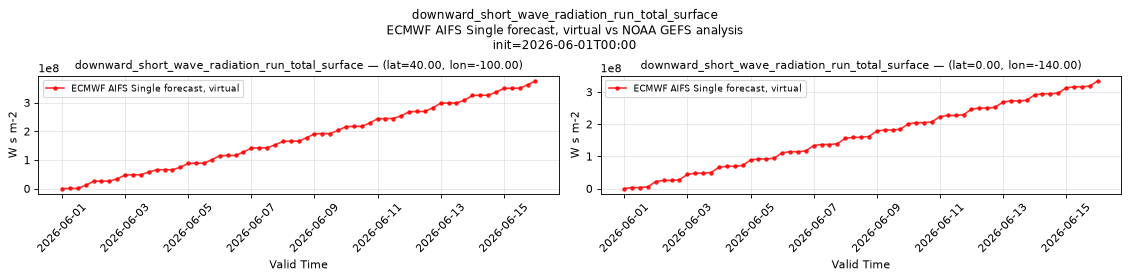
Temporal — init=2026-06-01T00:00
| Source | min | mean | max |
|---|---|---|---|
| P1 Validation | 0 | 1.759e+08 | 3.757e+08 |
| P2 Validation | 0 | 1.621e+08 | 3.34e+08 |
Availability — 2281 of 3598 positions complete (incomplete 2024-04-01T00:00 → 2025-02-24T00:00)
geopotential_height_surface
Metadata
| Field | Value |
|---|---|
| units | m |
| long_name | Geopotential height |
| short_name | gh |
| standard_name | geopotential_height |
| step_type | instant |
| comment | Surface (orography) geopotential height. Time-invariant field published at lead time 0 only. |
Point time series — 2024-04-01T00:00 - 2026-09-17T06:00, sampled lead=6h
| Point | min | mean | max |
|---|---|---|---|
| P1 | n/a | n/a | n/a |
| P2 | n/a | n/a | n/a |
Spatial — init=2026-06-01T00:00, lead=24h (reference not available)
| Source | min | mean | max |
|---|---|---|---|
| Validation | NaN | NaN | NaN |
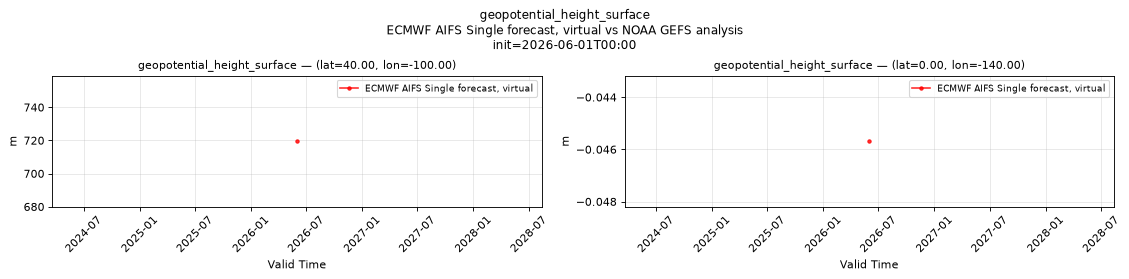
Temporal — init=2026-06-01T00:00
| Source | min | mean | max |
|---|---|---|---|
| P1 Validation | 719.6 | 719.6 | 719.6 |
| P2 Validation | -0.04568 | -0.04568 | -0.04568 |
Availability — 3597 of 3598 positions complete (incomplete 2025-01-21T06:00 → 2025-01-21T06:00)
high_cloud_cover
Metadata
| Field | Value |
|---|---|
| units | percent |
| long_name | High cloud cover |
| short_name | hcc |
| standard_name | cloud_area_fraction_in_atmosphere_layer |
| step_type | instant |
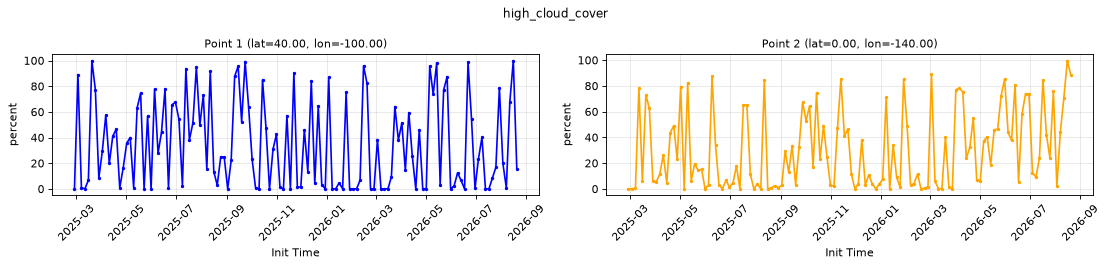
Point time series — 2024-04-01T00:00 - 2026-09-17T06:00, sampled lead=6h
| Point | min | mean | max |
|---|---|---|---|
| P1 | 0 | 34.97 | 100 |
| P2 | 0 | 32.27 | 99.65 |
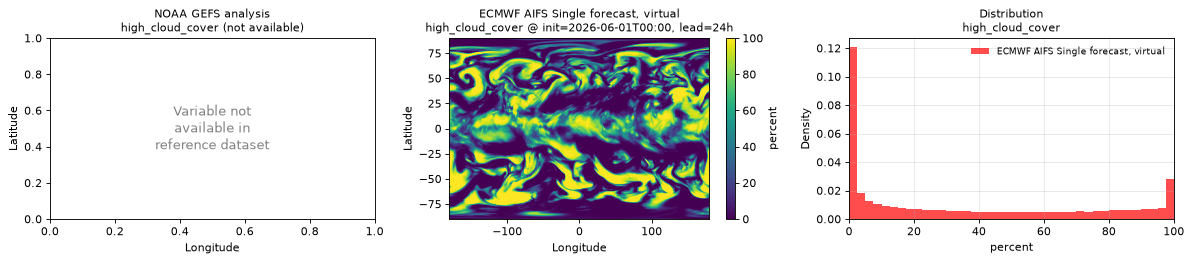
Spatial — init=2026-06-01T00:00, lead=24h (reference not available)
| Source | min | mean | max |
|---|---|---|---|
| Validation | 0 | 35.21 | 100 |
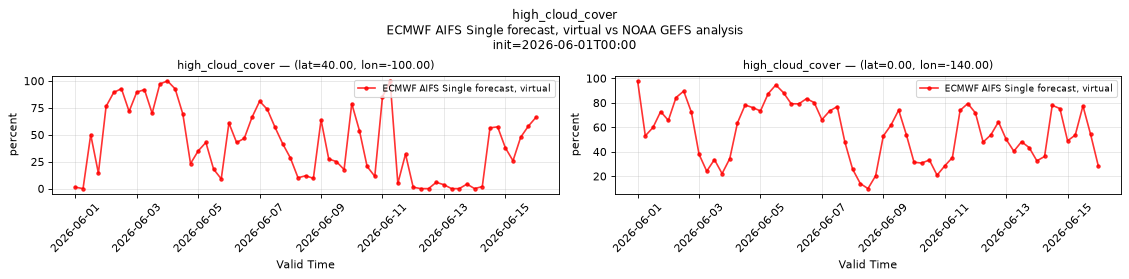
Temporal — init=2026-06-01T00:00
| Source | min | mean | max |
|---|---|---|---|
| P1 Validation | 0 | 41.84 | 100 |
| P2 Validation | 9.846 | 56.49 | 97.89 |
Availability — 2281 of 3598 positions complete (incomplete 2024-04-01T00:00 → 2025-02-24T00:00)
land_sea_mask_surface
Metadata
| Field | Value |
|---|---|
| units | 1 |
| long_name | Land-sea mask |
| short_name | lsm |
| standard_name | land_area_fraction |
| step_type | instant |
| comment | Fraction (0-1) of the grid box that is land. Time-invariant field published at lead time 0 only. |
Point time series — 2024-04-01T00:00 - 2026-09-17T06:00, sampled lead=6h
| Point | min | mean | max |
|---|---|---|---|
| P1 | n/a | n/a | n/a |
| P2 | n/a | n/a | n/a |
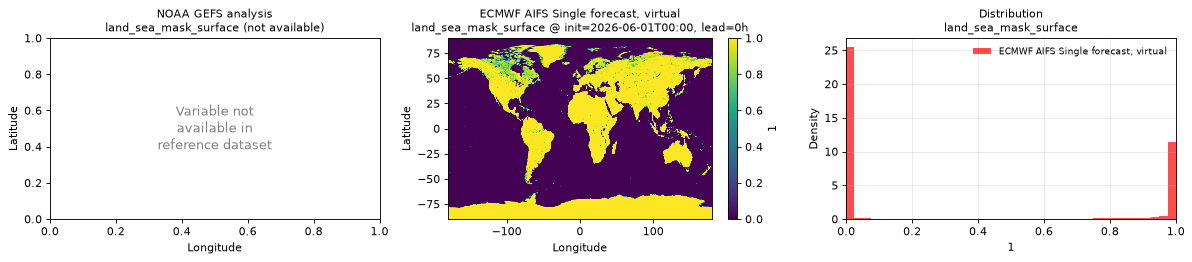
Spatial — init=2026-06-01T00:00, lead=24h (reference not available)
| Source | min | mean | max |
|---|---|---|---|
| Validation | NaN | NaN | NaN |
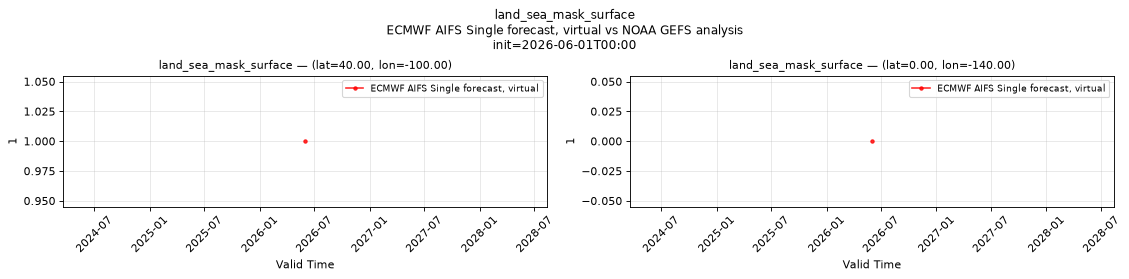
Temporal — init=2026-06-01T00:00
| Source | min | mean | max |
|---|---|---|---|
| P1 Validation | 1 | 1 | 1 |
| P2 Validation | 0 | 0 | 0 |
Availability — 3597 of 3598 positions complete (incomplete 2025-01-21T06:00 → 2025-01-21T06:00)
low_cloud_cover
Metadata
| Field | Value |
|---|---|
| units | percent |
| long_name | Low cloud cover |
| short_name | lcc |
| standard_name | cloud_area_fraction_in_atmosphere_layer |
| step_type | instant |
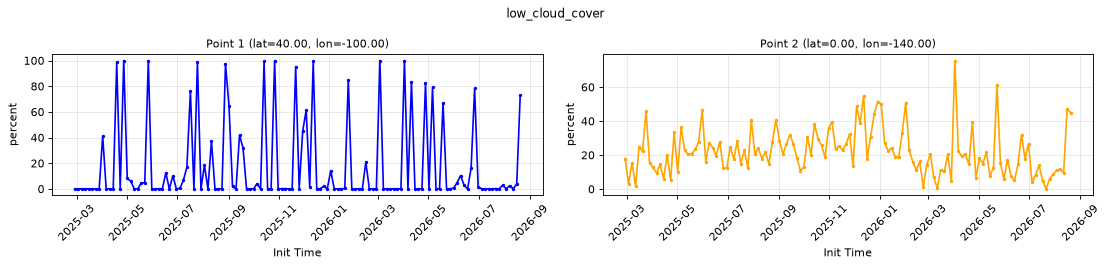
Point time series — 2024-04-01T00:00 - 2026-09-17T06:00, sampled lead=6h
| Point | min | mean | max |
|---|---|---|---|
| P1 | 0 | 16.68 | 100 |
| P2 | 0.08203 | 21.83 | 75.64 |
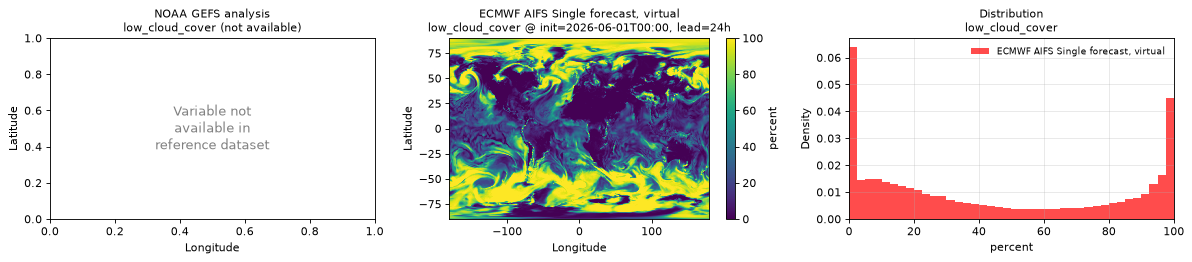
Spatial — init=2026-06-01T00:00, lead=24h (reference not available)
| Source | min | mean | max |
|---|---|---|---|
| Validation | 0 | 43.44 | 100 |
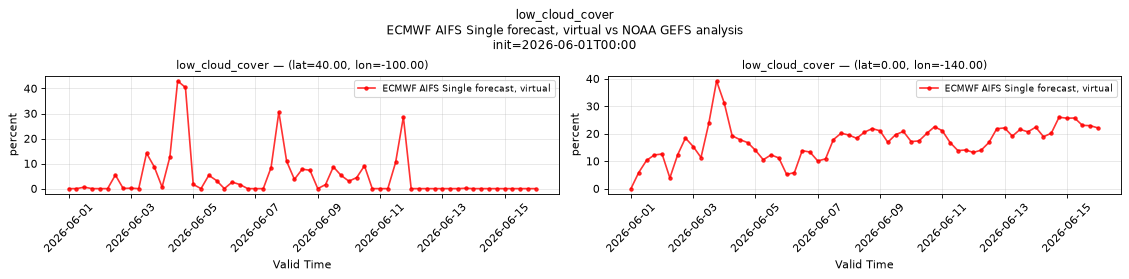
Temporal — init=2026-06-01T00:00
| Source | min | mean | max |
|---|---|---|---|
| P1 Validation | 0 | 4.593 | 43.01 |
| P2 Validation | 0 | 17.25 | 39.18 |
Availability — 2281 of 3598 positions complete (incomplete 2024-04-01T00:00 → 2025-02-24T00:00)
medium_cloud_cover
Metadata
| Field | Value |
|---|---|
| units | percent |
| long_name | Medium cloud cover |
| short_name | mcc |
| standard_name | cloud_area_fraction_in_atmosphere_layer |
| step_type | instant |
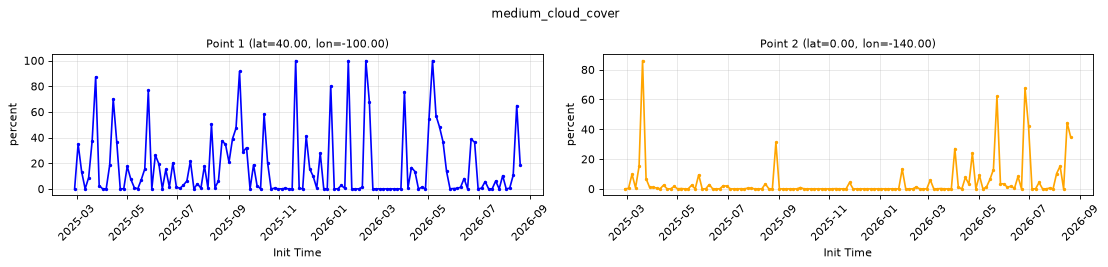
Point time series — 2024-04-01T00:00 - 2026-09-17T06:00, sampled lead=6h
| Point | min | mean | max |
|---|---|---|---|
| P1 | 0 | 17.44 | 100 |
| P2 | 0 | 5.484 | 86.12 |
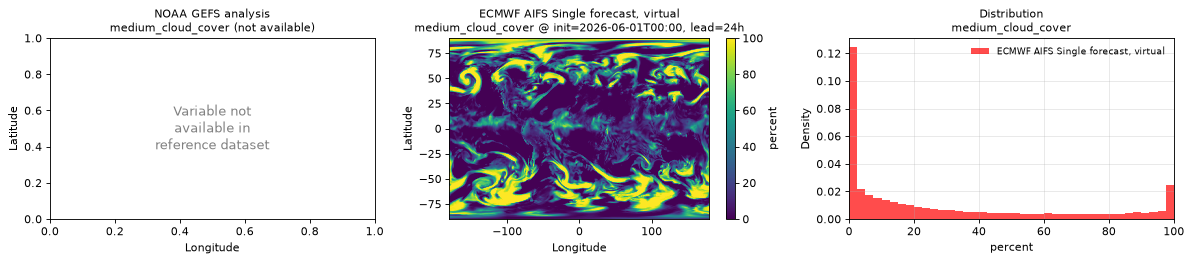
Spatial — init=2026-06-01T00:00, lead=24h (reference not available)
| Source | min | mean | max |
|---|---|---|---|
| Validation | 0 | 29.11 | 100 |
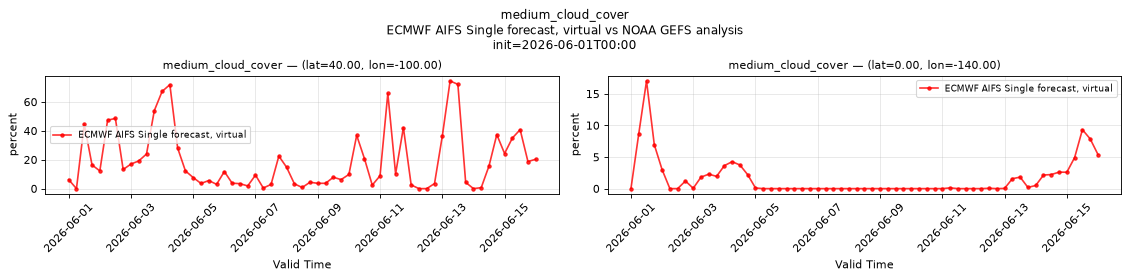
Temporal — init=2026-06-01T00:00
| Source | min | mean | max |
|---|---|---|---|
| P1 Validation | 0 | 19.43 | 74.48 |
| P2 Validation | 0 | 1.61 | 17.04 |
Availability — 2281 of 3598 positions complete (incomplete 2024-04-01T00:00 → 2025-02-24T00:00)
pressure_level/geopotential_height
Metadata
| Field | Value |
|---|---|
| units | m |
| long_name | Geopotential height |
| short_name | gh |
| standard_name | geopotential_height |
| step_type | instant |
| sampled level | pressure_level=300 |
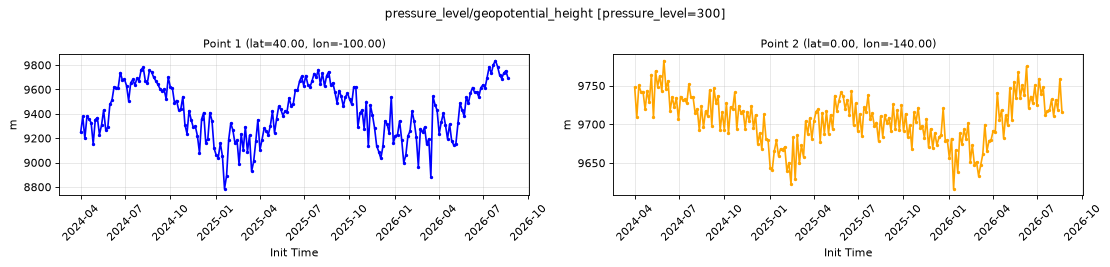
Point time series — 2024-04-01T00:00 - 2026-09-17T06:00, sampled lead=6h, pressure_level=300
| Point | min | mean | max |
|---|---|---|---|
| P1 | 8784 | 9427 | 9837 |
| P2 | 9616 | 9707 | 9783 |
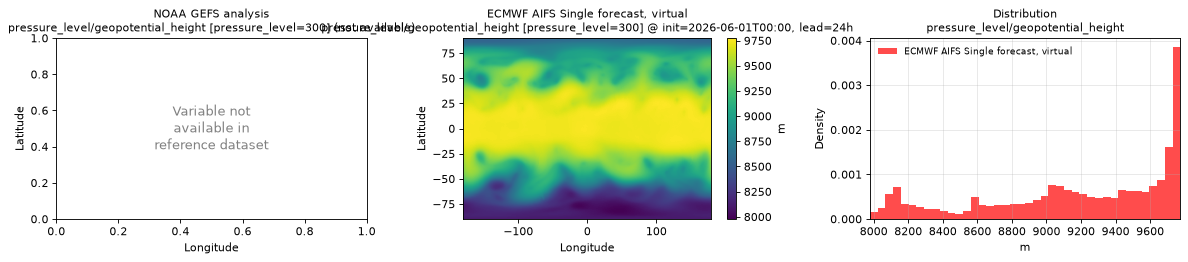
Spatial — init=2026-06-01T00:00, lead=24h (reference not available)
| Source | min | mean | max |
|---|---|---|---|
| Validation | 7978 | 9166 | 9775 |
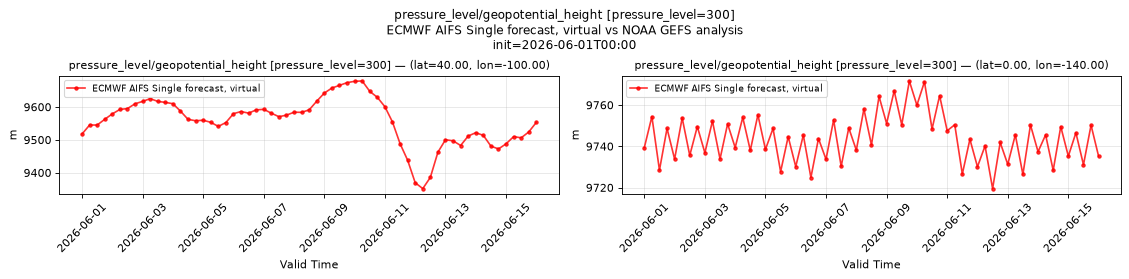
Temporal — init=2026-06-01T00:00
| Source | min | mean | max |
|---|---|---|---|
| P1 Validation | 9352 | 9558 | 9679 |
| P2 Validation | 9719 | 9744 | 9772 |
Availability — 3598 of 3598 positions complete
pressure_level/specific_humidity
Metadata
| Field | Value |
|---|---|
| units | 1 |
| long_name | Specific humidity |
| short_name | q |
| standard_name | specific_humidity |
| step_type | instant |
| sampled level | pressure_level=300 |
| comment | The source provides no 10 hPa level for this variable; that level is always NaN. |
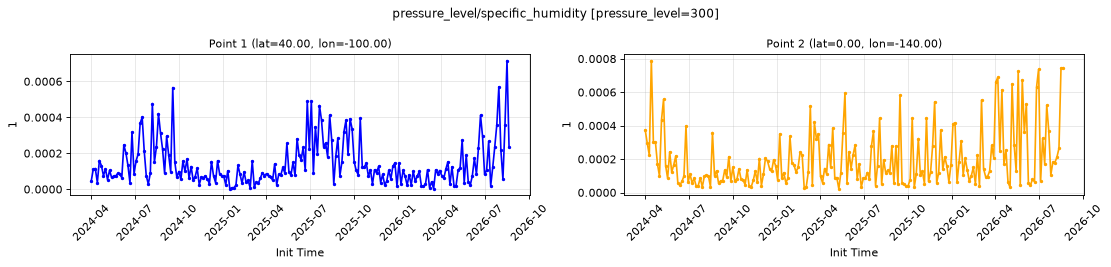
Point time series — 2024-04-01T00:00 - 2026-09-17T06:00, sampled lead=6h, pressure_level=300
| Point | min | mean | max |
|---|---|---|---|
| P1 | 1.97e-06 | 0.0001452 | 0.0007162 |
| P2 | 2.193e-05 | 0.0002013 | 0.0007894 |
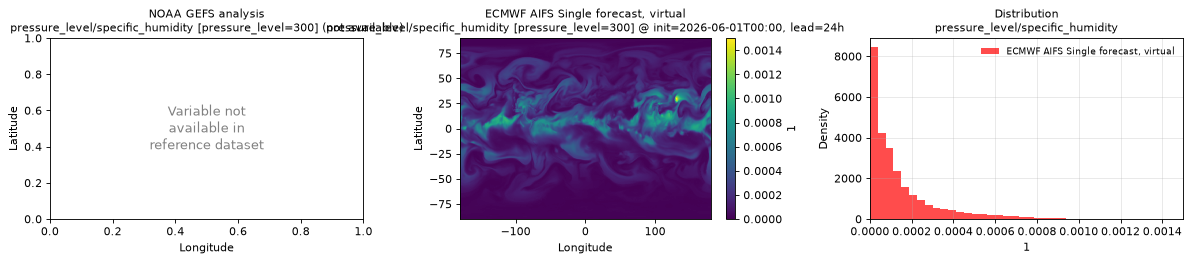
Spatial — init=2026-06-01T00:00, lead=24h (reference not available)
| Source | min | mean | max |
|---|---|---|---|
| Validation | 0 | 0.0001415 | 0.001501 |
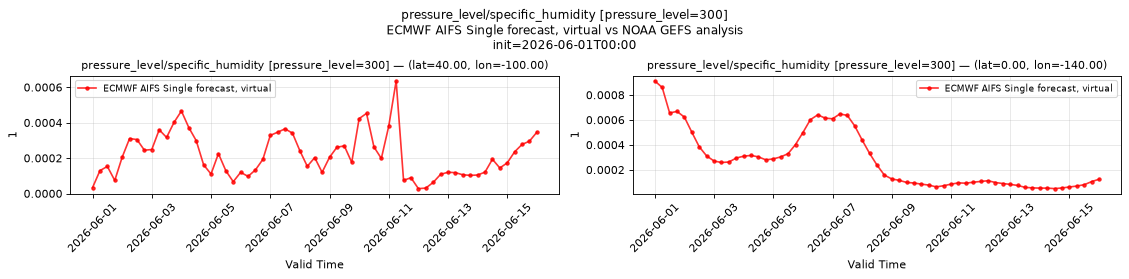
Temporal — init=2026-06-01T00:00
| Source | min | mean | max |
|---|---|---|---|
| P1 Validation | 2.775e-05 | 0.0002171 | 0.0006356 |
| P2 Validation | 4.904e-05 | 0.0002775 | 0.0009122 |
Availability — 3598 of 3598 positions complete
pressure_level/temperature
Metadata
| Field | Value |
|---|---|
| units | degree_Celsius |
| long_name | Temperature |
| short_name | t |
| standard_name | air_temperature |
| step_type | instant |
| sampled level | pressure_level=300 |
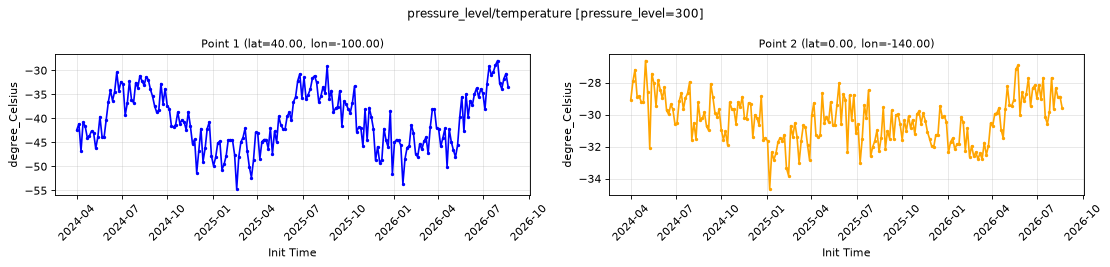
Point time series — 2024-04-01T00:00 - 2026-09-17T06:00, sampled lead=6h, pressure_level=300
| Point | min | mean | max |
|---|---|---|---|
| P1 | -54.67 | -40.2 | -27.96 |
| P2 | -34.64 | -30.26 | -26.62 |
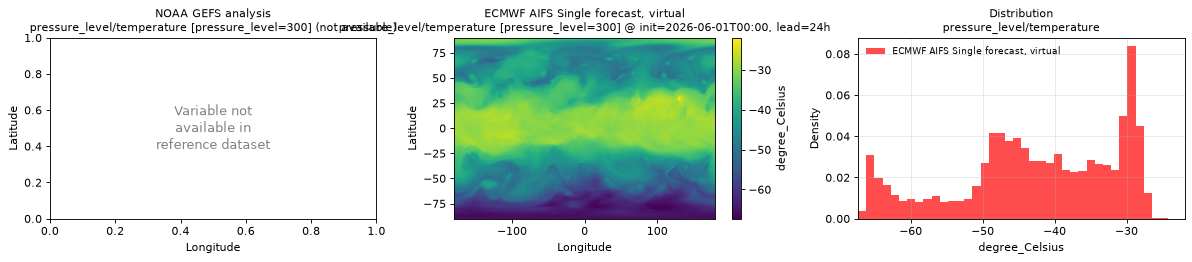
Spatial — init=2026-06-01T00:00, lead=24h (reference not available)
| Source | min | mean | max |
|---|---|---|---|
| Validation | -67.32 | -42.53 | -21.93 |
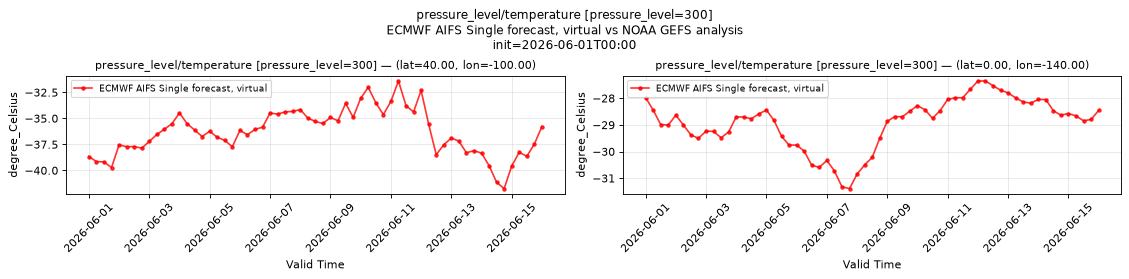
Temporal — init=2026-06-01T00:00
| Source | min | mean | max |
|---|---|---|---|
| P1 Validation | -41.75 | -36.32 | -31.4 |
| P2 Validation | -31.39 | -28.92 | -27.35 |
Availability — 3598 of 3598 positions complete
pressure_level/vertical_velocity
Metadata
| Field | Value |
|---|---|
| units | Pa s-1 |
| long_name | Vertical velocity |
| short_name | w |
| standard_name | lagrangian_tendency_of_air_pressure |
| step_type | instant |
| sampled level | pressure_level=300 |
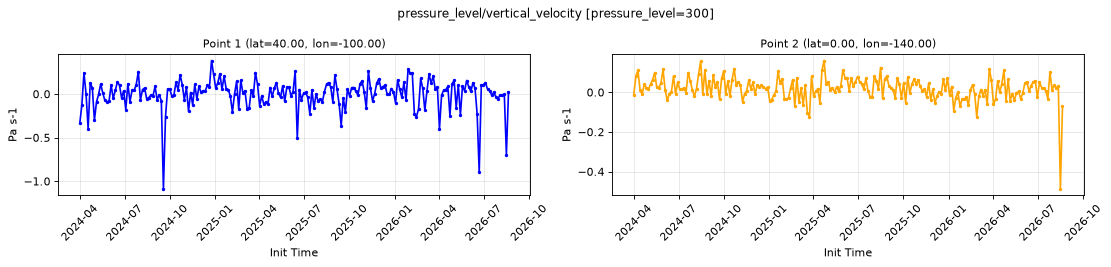
Point time series — 2024-04-01T00:00 - 2026-09-17T06:00, sampled lead=6h, pressure_level=300
| Point | min | mean | max |
|---|---|---|---|
| P1 | -1.088 | -0.003621 | 0.3828 |
| P2 | -0.4872 | 0.01821 | 0.1598 |
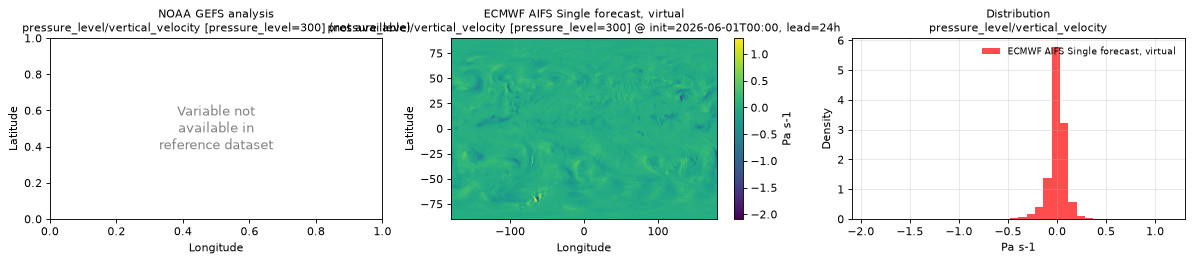
Spatial — init=2026-06-01T00:00, lead=24h (reference not available)
| Source | min | mean | max |
|---|---|---|---|
| Validation | -2.09 | -0.000917 | 1.3 |
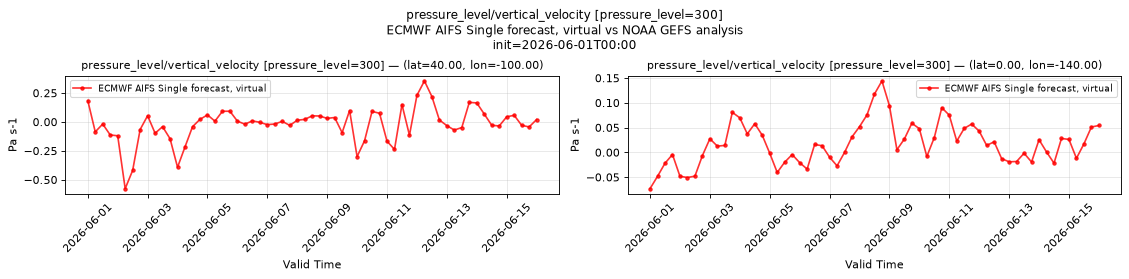
Temporal — init=2026-06-01T00:00
| Source | min | mean | max |
|---|---|---|---|
| P1 Validation | -0.5767 | -0.02138 | 0.3539 |
| P2 Validation | -0.07312 | 0.01719 | 0.1441 |
Availability — 3598 of 3598 positions complete
pressure_level/wind_u
Metadata
| Field | Value |
|---|---|
| units | m s-1 |
| long_name | U component of wind |
| short_name | u |
| standard_name | eastward_wind |
| step_type | instant |
| sampled level | pressure_level=300 |
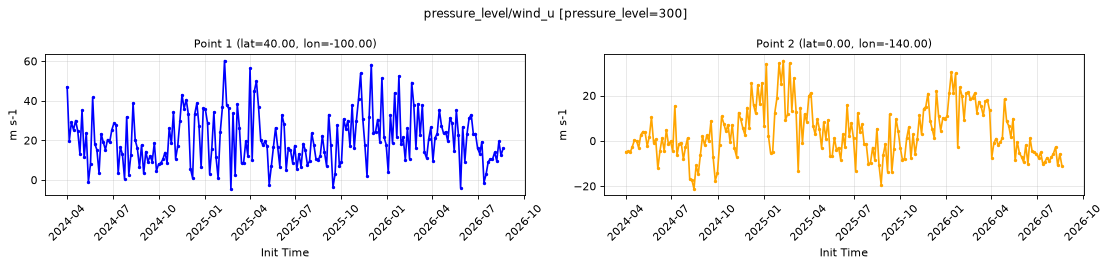
Point time series — 2024-04-01T00:00 - 2026-09-17T06:00, sampled lead=6h, pressure_level=300
| Point | min | mean | max |
|---|---|---|---|
| P1 | -4.528 | 20.54 | 60.3 |
| P2 | -21.23 | 3.215 | 35.49 |
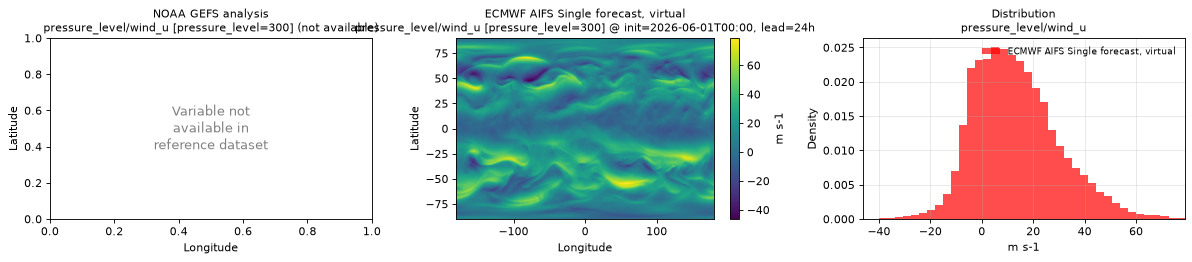
Spatial — init=2026-06-01T00:00, lead=24h (reference not available)
| Source | min | mean | max |
|---|---|---|---|
| Validation | -46.34 | 13.35 | 78.88 |
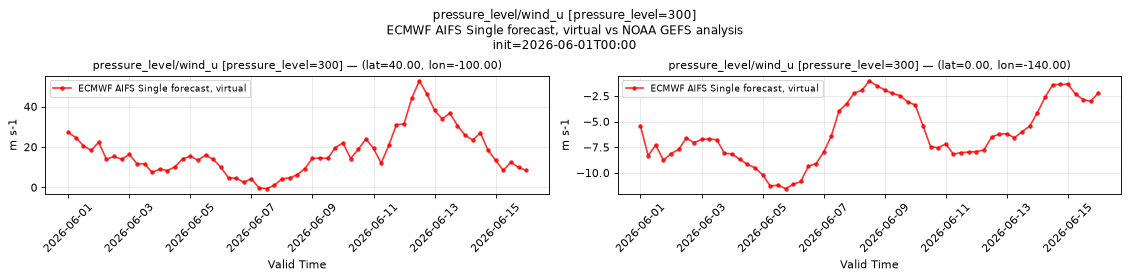
Temporal — init=2026-06-01T00:00
| Source | min | mean | max |
|---|---|---|---|
| P1 Validation | -0.6094 | 17.06 | 52.67 |
| P2 Validation | -11.54 | -6.148 | -1.042 |
Availability — 3598 of 3598 positions complete
pressure_level/wind_v
Metadata
| Field | Value |
|---|---|
| units | m s-1 |
| long_name | V component of wind |
| short_name | v |
| standard_name | northward_wind |
| step_type | instant |
| sampled level | pressure_level=300 |
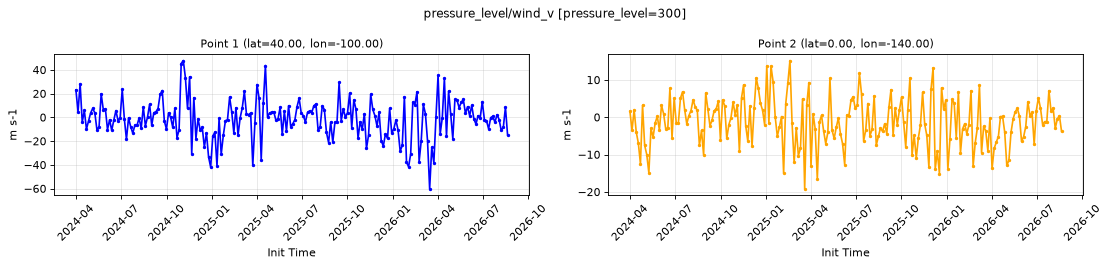
Point time series — 2024-04-01T00:00 - 2026-09-17T06:00, sampled lead=6h, pressure_level=300
| Point | min | mean | max |
|---|---|---|---|
| P1 | -60.25 | -1.469 | 47.8 |
| P2 | -19.2 | -1.273 | 15.17 |
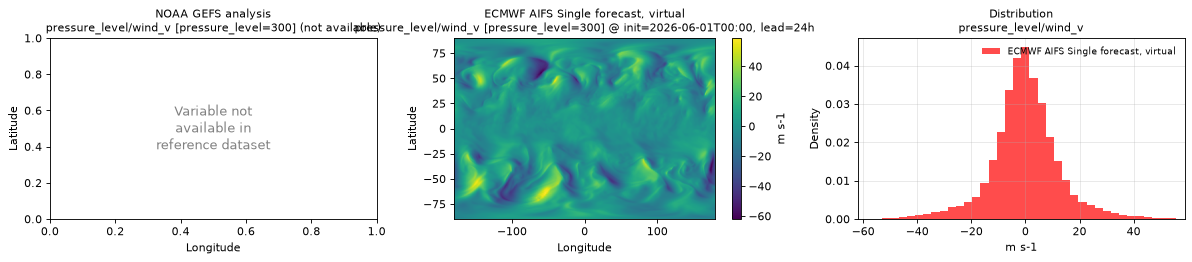
Spatial — init=2026-06-01T00:00, lead=24h (reference not available)
| Source | min | mean | max |
|---|---|---|---|
| Validation | -61.98 | -0.1691 | 58.86 |
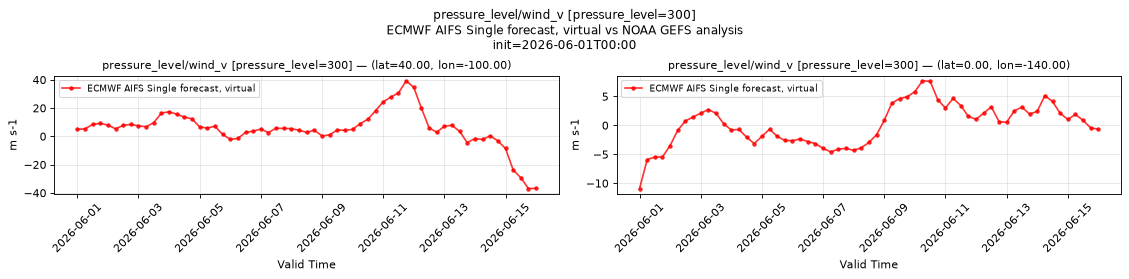
Temporal — init=2026-06-01T00:00
| Source | min | mean | max |
|---|---|---|---|
| P1 Validation | -36.94 | 5.405 | 39.19 |
| P2 Validation | -10.92 | 0.1193 | 7.668 |
Availability — 3598 of 3598 positions complete
pressure_reduced_to_mean_sea_level
Metadata
| Field | Value |
|---|---|
| units | Pa |
| long_name | Pressure reduced to MSL |
| short_name | prmsl |
| standard_name | air_pressure_at_mean_sea_level |
| step_type | instant |
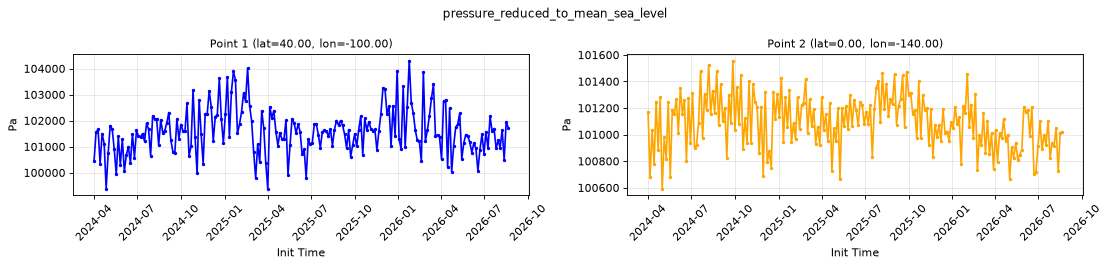
Point time series — 2024-04-01T00:00 - 2026-09-17T06:00, sampled lead=6h
| Point | min | mean | max |
|---|---|---|---|
| P1 | 9.938e+04 | 1.016e+05 | 1.043e+05 |
| P2 | 1.006e+05 | 1.011e+05 | 1.016e+05 |
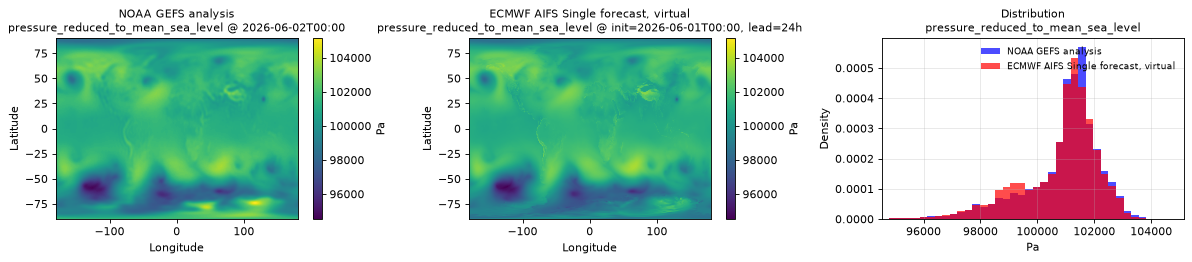
Spatial — init=2026-06-01T00:00, lead=24h (reference at 2026-06-02T00:00)
| Source | min | mean | max |
|---|---|---|---|
| Validation | 9.453e+04 | 1.008e+05 | 1.038e+05 |
| Reference | 9.466e+04 | 1.009e+05 | 1.052e+05 |
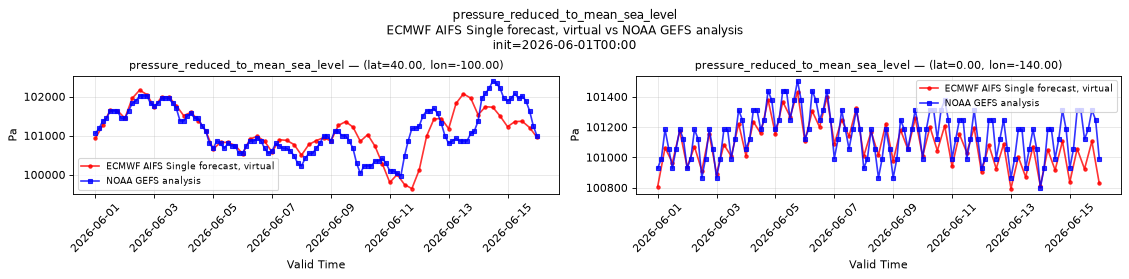
Temporal — init=2026-06-01T00:00
| Source | min | mean | max |
|---|---|---|---|
| P1 Validation | 9.964e+04 | 1.011e+05 | 1.022e+05 |
| P1 Reference | 9.997e+04 | 1.011e+05 | 1.024e+05 |
| P2 Validation | 1.008e+05 | 1.011e+05 | 1.014e+05 |
| P2 Reference | 1.008e+05 | 1.011e+05 | 1.015e+05 |
Availability — 3598 of 3598 positions complete
pressure_surface
Metadata
| Field | Value |
|---|---|
| units | Pa |
| long_name | Surface pressure |
| short_name | sp |
| standard_name | surface_air_pressure |
| step_type | instant |
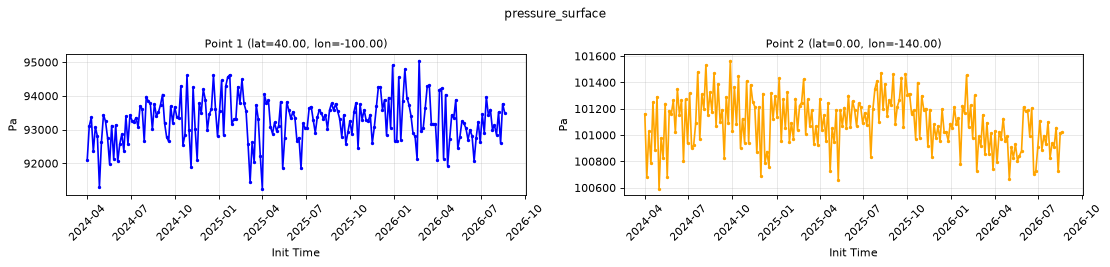
Point time series — 2024-04-01T00:00 - 2026-09-17T06:00, sampled lead=6h
| Point | min | mean | max |
|---|---|---|---|
| P1 | 9.124e+04 | 9.326e+04 | 9.505e+04 |
| P2 | 1.006e+05 | 1.011e+05 | 1.016e+05 |
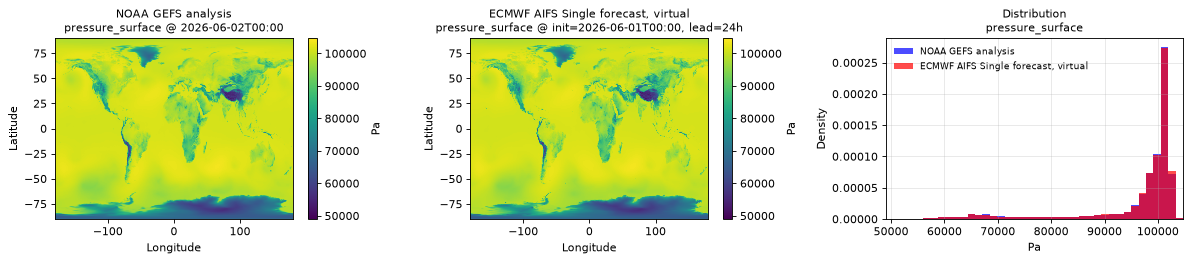
Spatial — init=2026-06-01T00:00, lead=24h (reference at 2026-06-02T00:00)
| Source | min | mean | max |
|---|---|---|---|
| Validation | 4.9e+04 | 9.652e+04 | 1.047e+05 |
| Reference | 5.072e+04 | 9.65e+04 | 1.037e+05 |
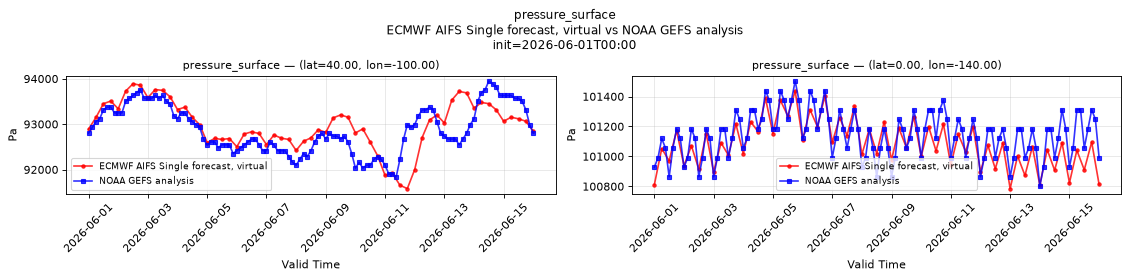
Temporal — init=2026-06-01T00:00
| Source | min | mean | max |
|---|---|---|---|
| P1 Validation | 9.158e+04 | 9.298e+04 | 9.389e+04 |
| P1 Reference | 9.184e+04 | 9.289e+04 | 9.395e+04 |
| P2 Validation | 1.008e+05 | 1.011e+05 | 1.014e+05 |
| P2 Reference | 1.008e+05 | 1.011e+05 | 1.015e+05 |
Availability — 3598 of 3598 positions complete
runoff_water_equivalent_run_total_surface
Metadata
| Field | Value |
|---|---|
| units | kg m-2 |
| long_name | Runoff water equivalent (surface plus subsurface) |
| short_name | rowe |
| standard_name | runoff_amount |
| step_type | accum |
| comment | Applies over land only. Water points are NaN from init time 2026-05-12T06:00 and unmasked before it. |
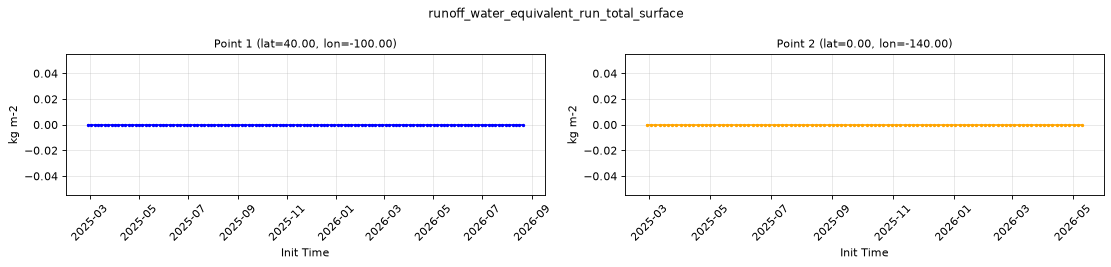
Point time series — 2024-04-01T00:00 - 2026-09-17T06:00, sampled lead=6h
| Point | min | mean | max |
|---|---|---|---|
| P1 | 0 | 0 | 0 |
| P2 | 0 | 0 | 0 |
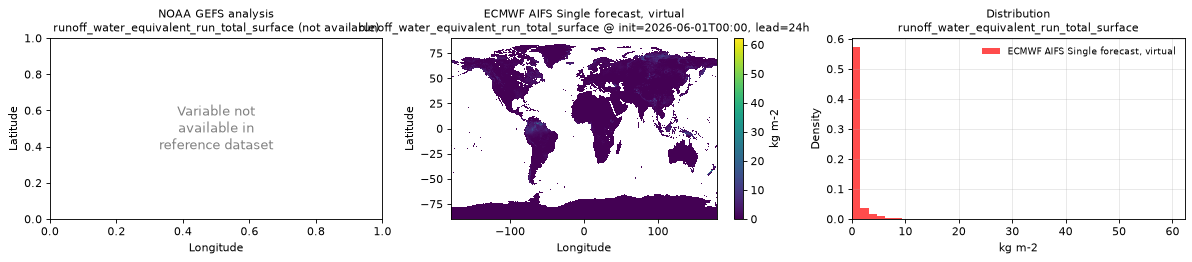
Spatial — init=2026-06-01T00:00, lead=24h (reference not available)
| Source | min | mean | max |
|---|---|---|---|
| Validation | 0 | 0.5223 | 62.27 |
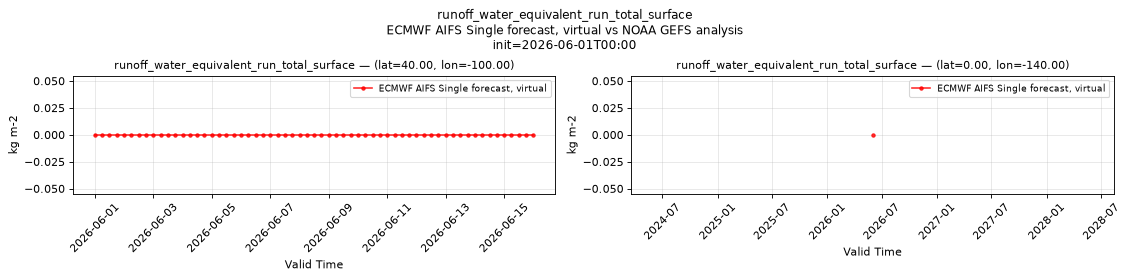
Temporal — init=2026-06-01T00:00
| Source | min | mean | max |
|---|---|---|---|
| P1 Validation | 0 | 0 | 0 |
| P2 Validation | 0 | 0 | 0 |
Availability — 2281 of 3598 positions complete (incomplete 2024-04-01T00:00 → 2025-02-24T00:00)
skin_temperature_surface
Metadata
| Field | Value |
|---|---|
| units | degree_Celsius |
| long_name | Skin temperature |
| short_name | skt |
| standard_name | surface_temperature |
| step_type | instant |
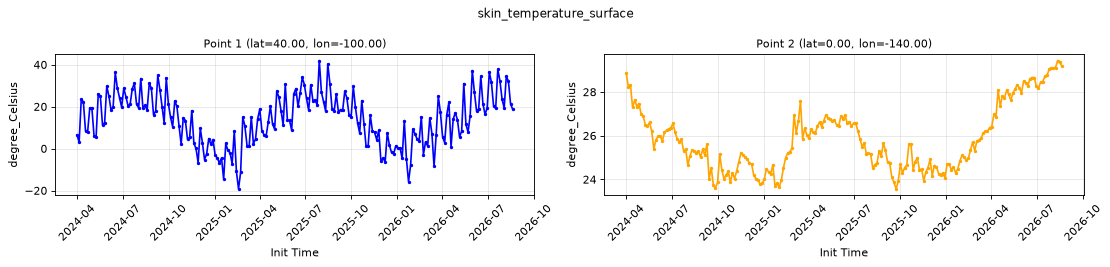
Point time series — 2024-04-01T00:00 - 2026-09-17T06:00, sampled lead=6h
| Point | min | mean | max |
|---|---|---|---|
| P1 | -19.2 | 14.53 | 41.94 |
| P2 | 23.57 | 25.95 | 29.93 |
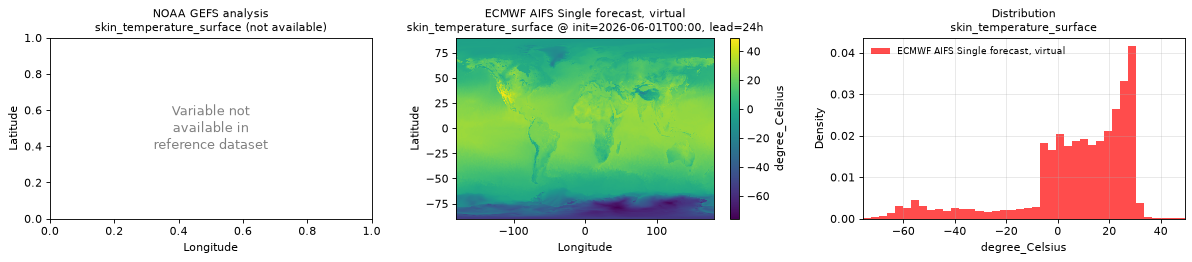
Spatial — init=2026-06-01T00:00, lead=24h (reference not available)
| Source | min | mean | max |
|---|---|---|---|
| Validation | -75.73 | 7.164 | 49.27 |
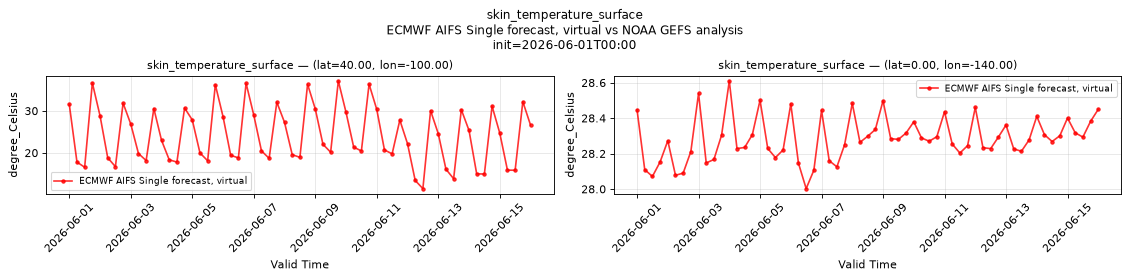
Temporal — init=2026-06-01T00:00
| Source | min | mean | max |
|---|---|---|---|
| P1 Validation | 11.48 | 24.13 | 37.13 |
| P2 Validation | 28 | 28.28 | 28.61 |
Availability — 3598 of 3598 positions complete
slope_of_sub_gridscale_orography_surface
Metadata
| Field | Value |
|---|---|
| units | 1 |
| long_name | Slope of sub-gridscale orography |
| short_name | slor |
| standard_name | n/a |
| step_type | instant |
| comment | Time-invariant field published at lead time 0 only. |
Point time series — 2024-04-01T00:00 - 2026-09-17T06:00, sampled lead=6h
| Point | min | mean | max |
|---|---|---|---|
| P1 | n/a | n/a | n/a |
| P2 | n/a | n/a | n/a |
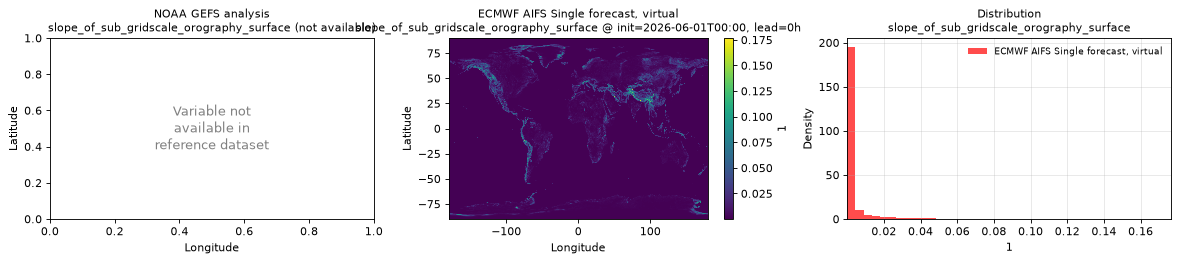
Spatial — init=2026-06-01T00:00, lead=24h (reference not available)
| Source | min | mean | max |
|---|---|---|---|
| Validation | NaN | NaN | NaN |
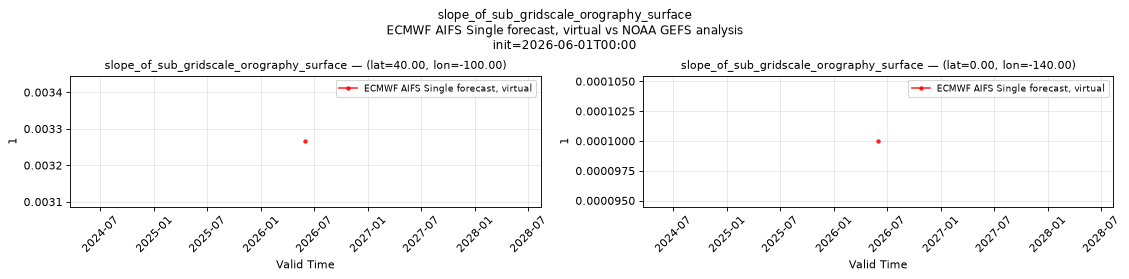
Temporal — init=2026-06-01T00:00
| Source | min | mean | max |
|---|---|---|---|
| P1 Validation | 0.003266 | 0.003266 | 0.003266 |
| P2 Validation | 9.999e-05 | 9.999e-05 | 9.999e-05 |
Availability — 2281 of 3598 positions complete (incomplete 2024-04-01T00:00 → 2025-02-24T00:00)
snow_area_fraction_surface
Metadata
| Field | Value |
|---|---|
| units | 1 |
| long_name | Snow cover |
| short_name | snowc |
| standard_name | surface_snow_area_fraction |
| step_type | instant |
| comment | Fraction (0-1) of the grid box covered by snow. Applies over land only; NaN over water, except at forecast hour 0, which has values over water: 0 over open ocean and up to 1 in polar seas. |
Point time series — 2024-04-01T00:00 - 2026-09-17T06:00, sampled lead=6h
| Point | min | mean | max |
|---|---|---|---|
| P1 | 0 | 0 | 0 |
| P2 | n/a | n/a | n/a |
Spatial — init=2026-06-01T00:00, lead=24h (reference not available)
| Source | min | mean | max |
|---|---|---|---|
| Validation | 0 | 0.3891 | 1 |
Temporal — init=2026-06-01T00:00
| Source | min | mean | max |
|---|---|---|---|
| P1 Validation | 0 | 0 | 0 |
| P2 Validation | 0 | 0 | 0 |
Availability — 510 of 3598 positions complete (incomplete 2024-04-01T00:00 → 2026-05-12T18:00)
snowfall_water_equivalent_run_total_surface
Metadata
| Field | Value |
|---|---|
| units | kg m-2 |
| long_name | Snowfall water equivalent |
| short_name | sf |
| standard_name | snowfall_amount |
| step_type | accum |
Point time series — 2024-04-01T00:00 - 2026-09-17T06:00, sampled lead=6h
| Point | min | mean | max |
|---|---|---|---|
| P1 | 0 | 0.009223 | 1.068 |
| P2 | 0 | 0 | 0 |
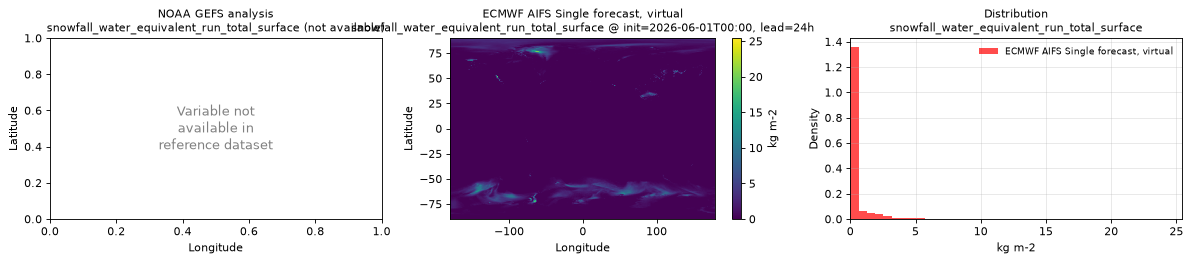
Spatial — init=2026-06-01T00:00, lead=24h (reference not available)
| Source | min | mean | max |
|---|---|---|---|
| Validation | 0 | 0.35 | 25.43 |
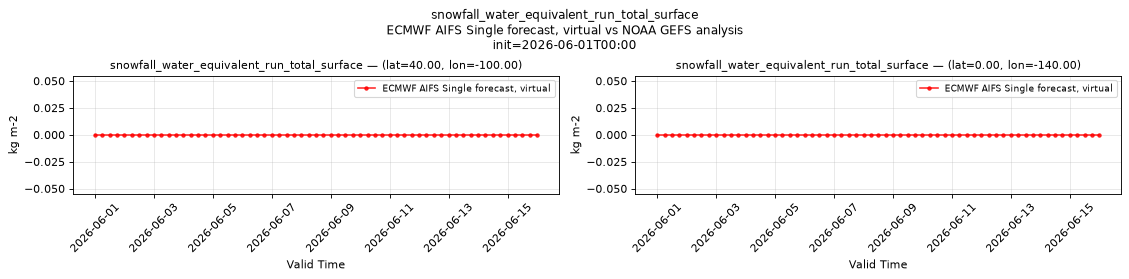
Temporal — init=2026-06-01T00:00
| Source | min | mean | max |
|---|---|---|---|
| P1 Validation | 0 | 0 | 0 |
| P2 Validation | 0 | 0 | 0 |
Availability — 2281 of 3598 positions complete (incomplete 2024-04-01T00:00 → 2025-02-24T00:00)
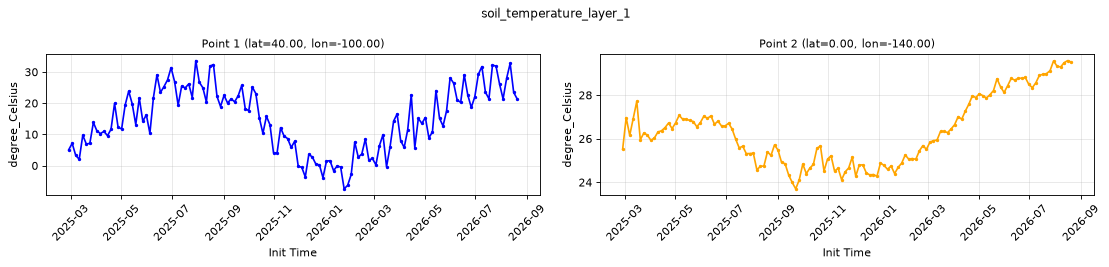
soil_temperature_layer_1
Metadata
| Field | Value |
|---|---|
| units | degree_Celsius |
| long_name | Soil temperature |
| short_name | sot |
| standard_name | soil_temperature |
| step_type | instant |
| comment | ECMWF soil level 1, the uppermost soil layer. Over water this is the sea surface temperature, not a soil temperature. |
Point time series — 2024-04-01T00:00 - 2026-09-17T06:00, sampled lead=6h
| Point | min | mean | max |
|---|---|---|---|
| P1 | -7.434 | 15.31 | 33.65 |
| P2 | 23.7 | 26.48 | 29.98 |
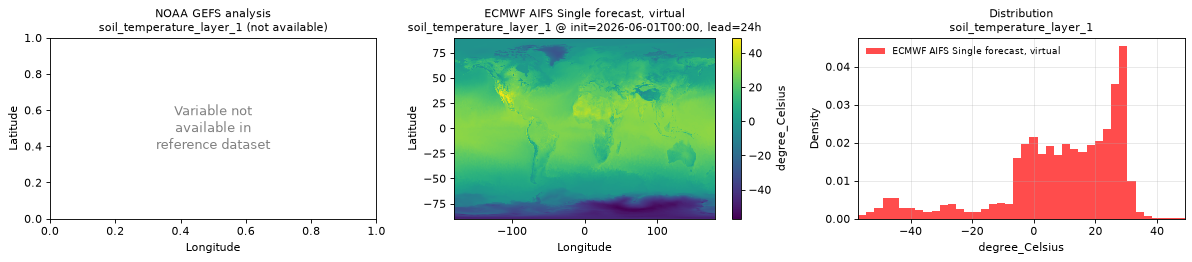
Spatial — init=2026-06-01T00:00, lead=24h (reference not available)
| Source | min | mean | max |
|---|---|---|---|
| Validation | -57.04 | 8.411 | 48.93 |
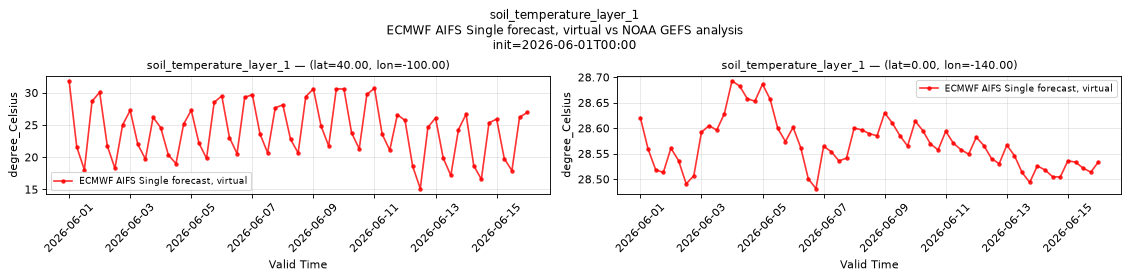
Temporal — init=2026-06-01T00:00
| Source | min | mean | max |
|---|---|---|---|
| P1 Validation | 15.11 | 24.14 | 31.83 |
| P2 Validation | 28.48 | 28.57 | 28.69 |
Availability — 2281 of 3598 positions complete (incomplete 2024-04-01T00:00 → 2025-02-24T00:00)
soil_temperature_layer_2
Metadata
| Field | Value |
|---|---|
| units | degree_Celsius |
| long_name | Soil temperature |
| short_name | sot |
| standard_name | soil_temperature |
| step_type | instant |
| comment | ECMWF soil level 2, the second soil layer from the surface. Over water this is the sea surface temperature, not a soil temperature. |
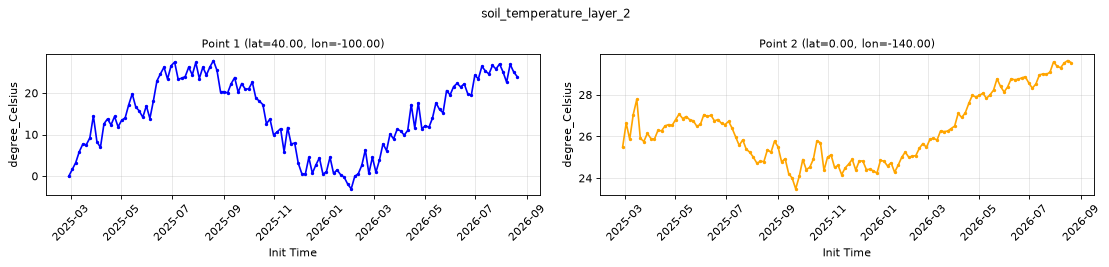
Point time series — 2024-04-01T00:00 - 2026-09-17T06:00, sampled lead=6h
| Point | min | mean | max |
|---|---|---|---|
| P1 | -3.087 | 14.97 | 27.82 |
| P2 | 23.48 | 26.46 | 29.99 |
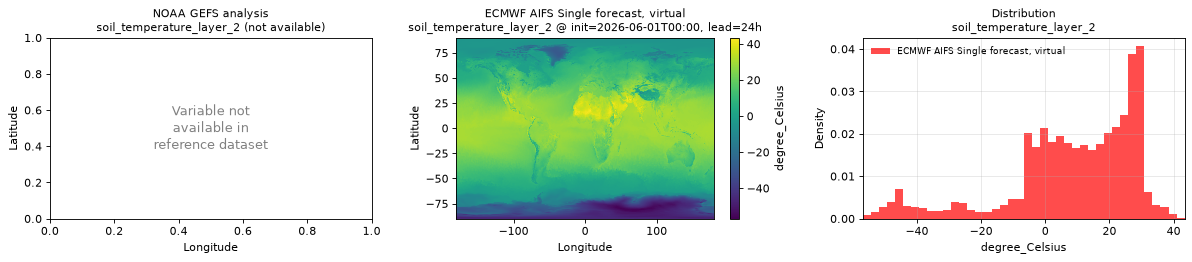
Spatial — init=2026-06-01T00:00, lead=24h (reference not available)
| Source | min | mean | max |
|---|---|---|---|
| Validation | -56.88 | 8.544 | 43.43 |
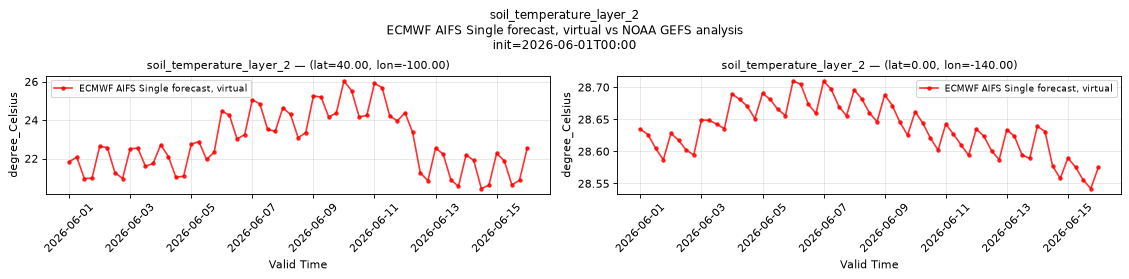
Temporal — init=2026-06-01T00:00
| Source | min | mean | max |
|---|---|---|---|
| P1 Validation | 20.43 | 22.85 | 26.04 |
| P2 Validation | 28.54 | 28.64 | 28.71 |
Availability — 2281 of 3598 positions complete (incomplete 2024-04-01T00:00 → 2025-02-24T00:00)
standard_deviation_of_sub_gridscale_orography_surface
Metadata
| Field | Value |
|---|---|
| units | m |
| long_name | Standard deviation of sub-gridscale orography |
| short_name | sdor |
| standard_name | n/a |
| step_type | instant |
| comment | Time-invariant field published at lead time 0 only. |
Point time series — 2024-04-01T00:00 - 2026-09-17T06:00, sampled lead=6h
| Point | min | mean | max |
|---|---|---|---|
| P1 | n/a | n/a | n/a |
| P2 | n/a | n/a | n/a |
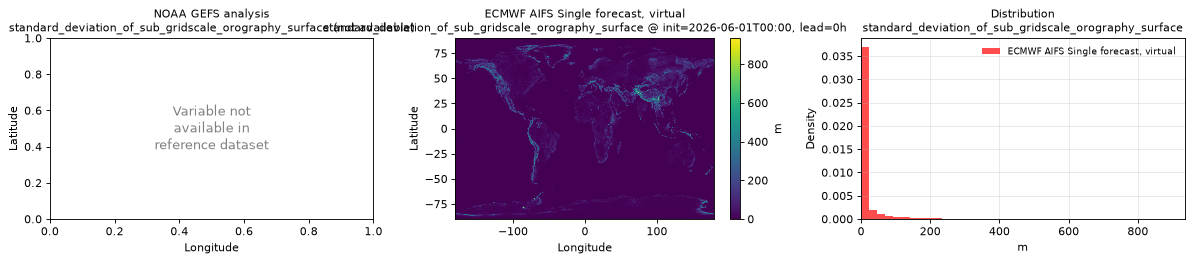
Spatial — init=2026-06-01T00:00, lead=24h (reference not available)
| Source | min | mean | max |
|---|---|---|---|
| Validation | NaN | NaN | NaN |
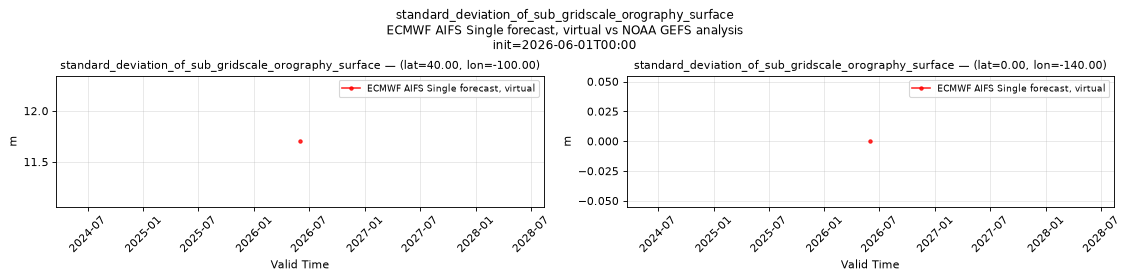
Temporal — init=2026-06-01T00:00
| Source | min | mean | max |
|---|---|---|---|
| P1 Validation | 11.7 | 11.7 | 11.7 |
| P2 Validation | 0 | 0 | 0 |
Availability — 2281 of 3598 positions complete (incomplete 2024-04-01T00:00 → 2025-02-24T00:00)
temperature_2m
Metadata
| Field | Value |
|---|---|
| units | degree_Celsius |
| long_name | 2 metre temperature |
| short_name | 2t |
| standard_name | air_temperature |
| step_type | instant |
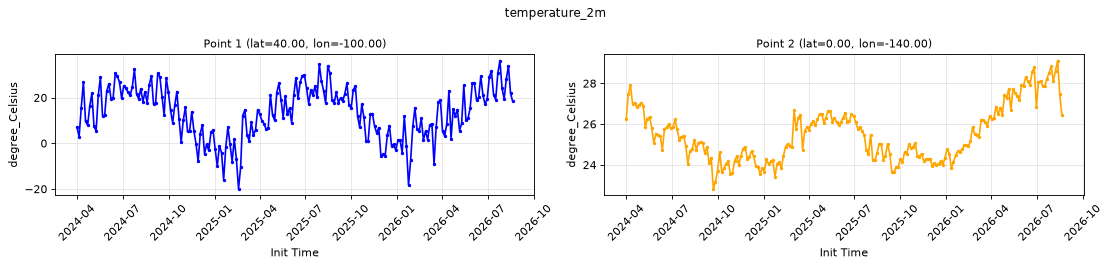
Point time series — 2024-04-01T00:00 - 2026-09-17T06:00, sampled lead=6h
| Point | min | mean | max |
|---|---|---|---|
| P1 | -19.97 | 13.86 | 36.25 |
| P2 | 22.82 | 25.59 | 29.72 |
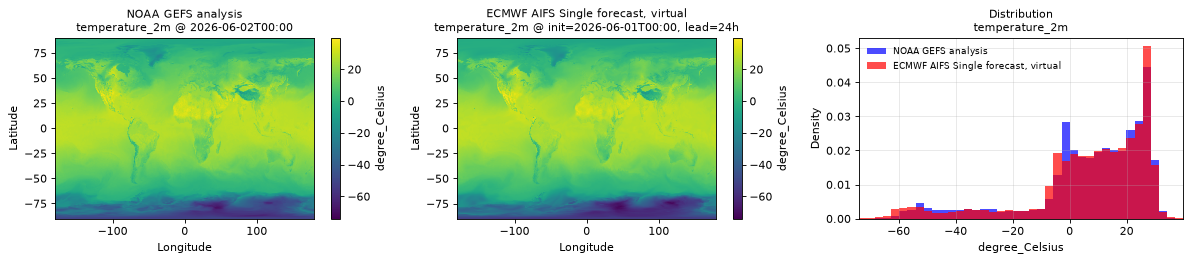
Spatial — init=2026-06-01T00:00, lead=24h (reference at 2026-06-02T00:00)
| Source | min | mean | max |
|---|---|---|---|
| Validation | -74.01 | 7.061 | 39.84 |
| Reference | -69.5 | 7.225 | 38.25 |
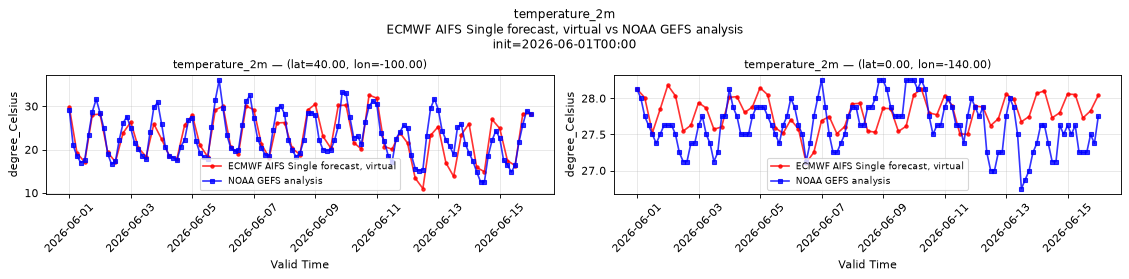
Temporal — init=2026-06-01T00:00
| Source | min | mean | max |
|---|---|---|---|
| P1 Validation | 11 | 22.89 | 32.58 |
| P1 Reference | 12.5 | 23.06 | 36 |
| P2 Validation | 27.11 | 27.8 | 28.18 |
| P2 Reference | 26.75 | 27.63 | 28.25 |
Availability — 3598 of 3598 positions complete
total_cloud_cover_atmosphere
Metadata
| Field | Value |
|---|---|
| units | percent |
| long_name | Total cloud cover |
| short_name | tcc |
| standard_name | cloud_area_fraction |
| step_type | instant |
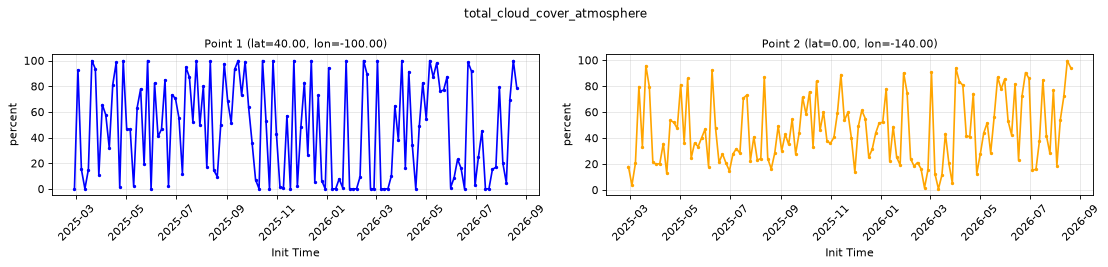
Point time series — 2024-04-01T00:00 - 2026-09-17T06:00, sampled lead=6h
| Point | min | mean | max |
|---|---|---|---|
| P1 | 0 | 46.76 | 100 |
| P2 | 0.7715 | 47.49 | 99.65 |
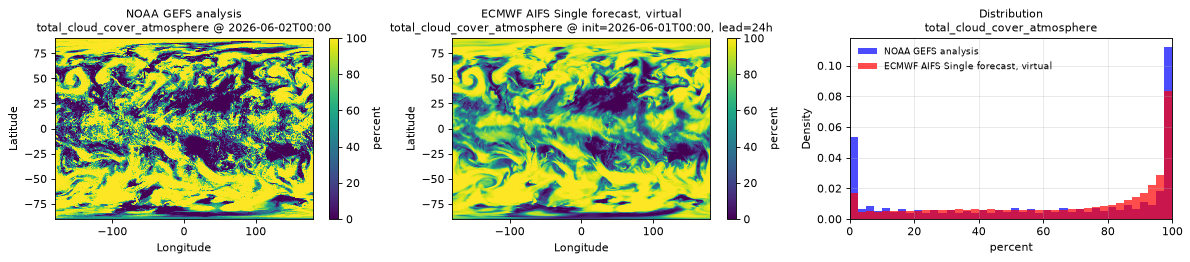
Spatial — init=2026-06-01T00:00, lead=24h (reference at 2026-06-02T00:00)
| Source | min | mean | max |
|---|---|---|---|
| Validation | 0 | 66.96 | 100 |
| Reference | 0 | 60.13 | 100 |
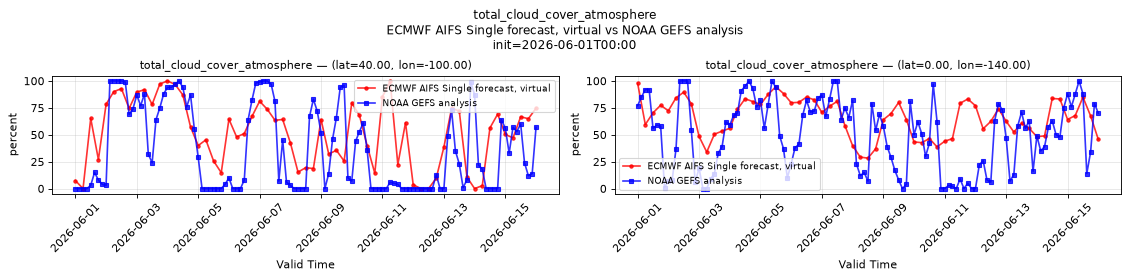
Temporal — init=2026-06-01T00:00
| Source | min | mean | max |
|---|---|---|---|
| P1 Validation | 0 | 51.43 | 100 |
| P1 Reference | 0 | 36.48 | 100 |
| P2 Validation | 28.29 | 65.65 | 97.89 |
| P2 Reference | 0 | 49.9 | 100 |
Availability — 2281 of 3598 positions complete (incomplete 2024-04-01T00:00 → 2025-02-24T00:00)
total_column_water_atmosphere
Metadata
| Field | Value |
|---|---|
| units | kg m-2 |
| long_name | Total column water |
| short_name | tcw |
| standard_name | atmosphere_mass_content_of_water |
| step_type | instant |
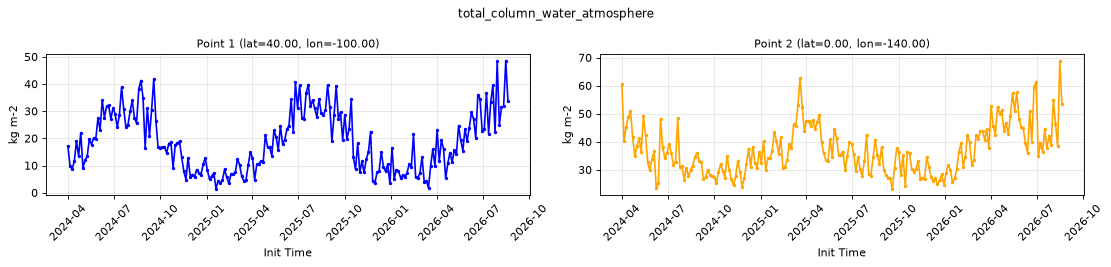
Point time series — 2024-04-01T00:00 - 2026-09-17T06:00, sampled lead=6h
| Point | min | mean | max |
|---|---|---|---|
| P1 | 1.405 | 19.2 | 48.59 |
| P2 | 23.19 | 37.37 | 68.94 |
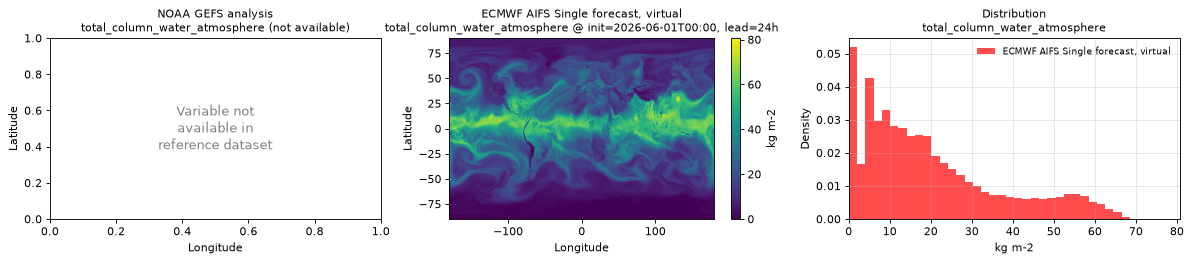
Spatial — init=2026-06-01T00:00, lead=24h (reference not available)
| Source | min | mean | max |
|---|---|---|---|
| Validation | 0 | 20.13 | 80.66 |
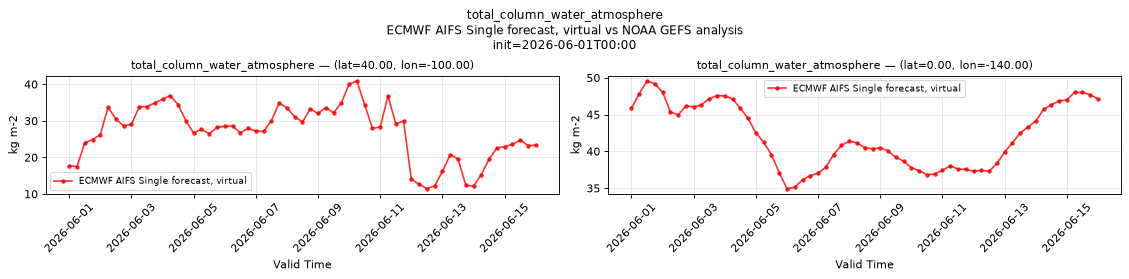
Temporal — init=2026-06-01T00:00
| Source | min | mean | max |
|---|---|---|---|
| P1 Validation | 11.47 | 27 | 40.91 |
| P2 Validation | 34.94 | 42.08 | 49.56 |
Availability — 3598 of 3598 positions complete
total_precipitation_run_total_surface
Metadata
| Field | Value |
|---|---|
| units | kg m-2 |
| long_name | Total precipitation |
| short_name | tp |
| standard_name | precipitation_amount |
| step_type | accum |
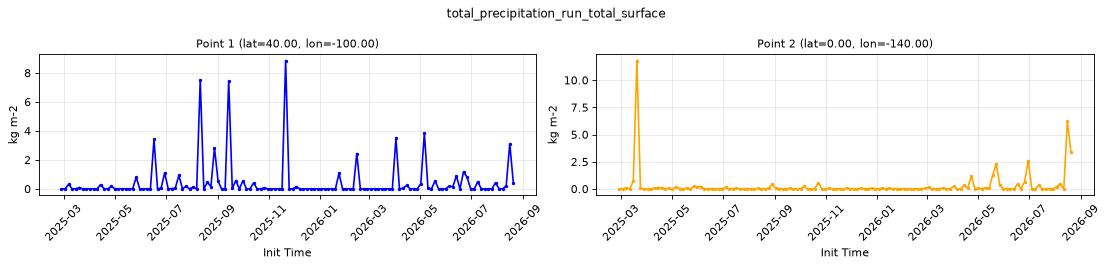
Point time series — 2024-04-01T00:00 - 2026-09-17T06:00, sampled lead=6h
| Point | min | mean | max |
|---|---|---|---|
| P1 | 0 | 0.4805 | 8.851 |
| P2 | 0 | 0.3128 | 11.8 |
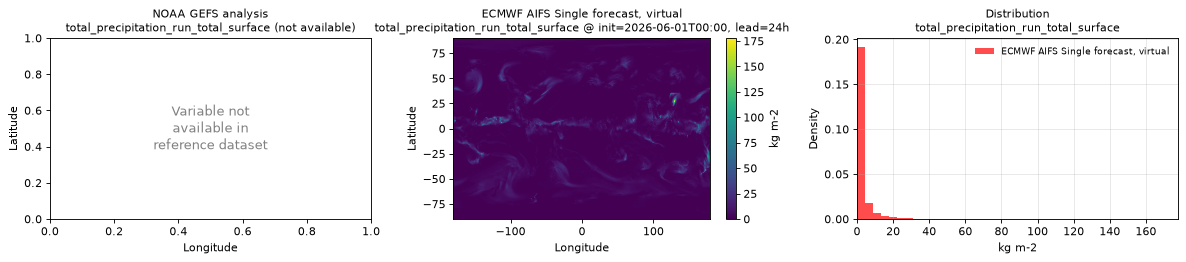
Spatial — init=2026-06-01T00:00, lead=24h (reference not available)
| Source | min | mean | max |
|---|---|---|---|
| Validation | 0 | 2.416 | 177.9 |
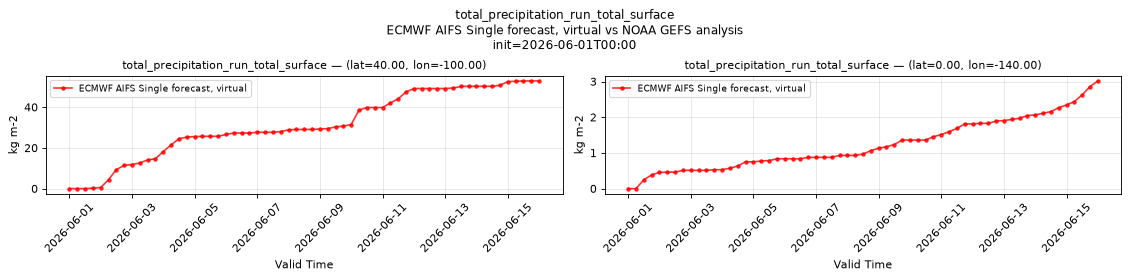
Temporal — init=2026-06-01T00:00
| Source | min | mean | max |
|---|---|---|---|
| P1 Validation | 0 | 31.31 | 52.86 |
| P2 Validation | 0 | 1.232 | 3.016 |
Availability — 2281 of 3598 positions complete (incomplete 2024-04-01T00:00 → 2025-02-24T00:00)
volumetric_soil_moisture_layer_1
Metadata
| Field | Value |
|---|---|
| units | 1 |
| long_name | Volumetric soil moisture |
| short_name | vsw |
| standard_name | volume_fraction_of_condensed_water_in_soil |
| step_type | instant |
| comment | ECMWF soil level 1, the uppermost soil layer. Applies over land only. Water points are NaN from init time 2026-05-12T06:00 and unmasked before it. |
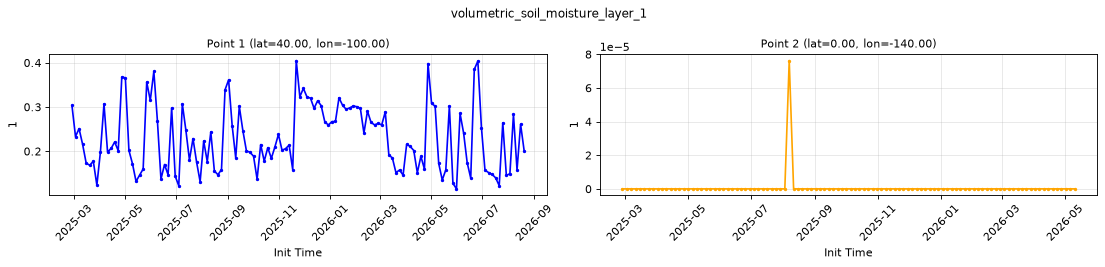
Point time series — 2024-04-01T00:00 - 2026-09-17T06:00, sampled lead=6h
| Point | min | mean | max |
|---|---|---|---|
| P1 | 0.115 | 0.2282 | 0.4049 |
| P2 | 0 | 7.336e-07 | 7.629e-05 |
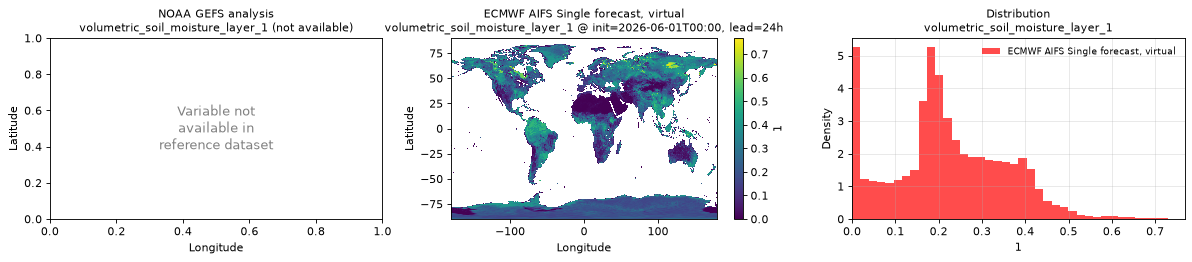
Spatial — init=2026-06-01T00:00, lead=24h (reference not available)
| Source | min | mean | max |
|---|---|---|---|
| Validation | 0 | 0.2199 | 0.768 |
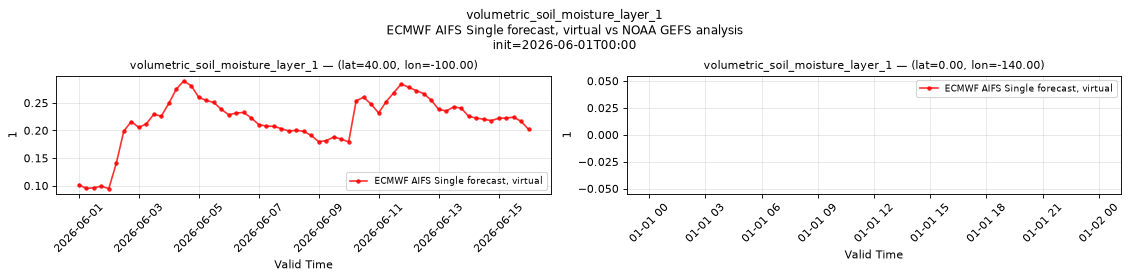
Temporal — init=2026-06-01T00:00
| Source | min | mean | max |
|---|---|---|---|
| P1 Validation | 0.0947 | 0.2174 | 0.2897 |
| P2 Validation | n/a | n/a | n/a |
Availability — 2281 of 3598 positions complete (incomplete 2024-04-01T00:00 → 2025-02-24T00:00)
volumetric_soil_moisture_layer_2
Metadata
| Field | Value |
|---|---|
| units | 1 |
| long_name | Volumetric soil moisture |
| short_name | vsw |
| standard_name | volume_fraction_of_condensed_water_in_soil |
| step_type | instant |
| comment | ECMWF soil level 2, the second soil layer from the surface. Applies over land only. Water points are NaN from init time 2026-05-12T06:00 and unmasked before it. |
Point time series — 2024-04-01T00:00 - 2026-09-17T06:00, sampled lead=6h
| Point | min | mean | max |
|---|---|---|---|
| P1 | 0.1496 | 0.2421 | 0.4201 |
| P2 | 0 | 1.951e-05 | 0.0009613 |
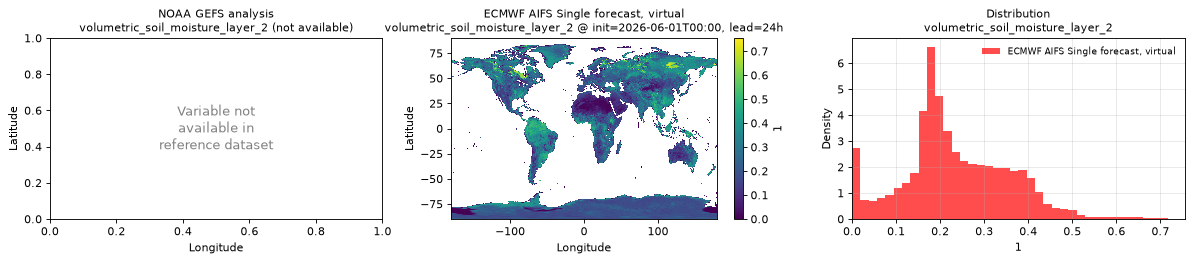
Spatial — init=2026-06-01T00:00, lead=24h (reference not available)
| Source | min | mean | max |
|---|---|---|---|
| Validation | 0 | 0.2334 | 0.7548 |
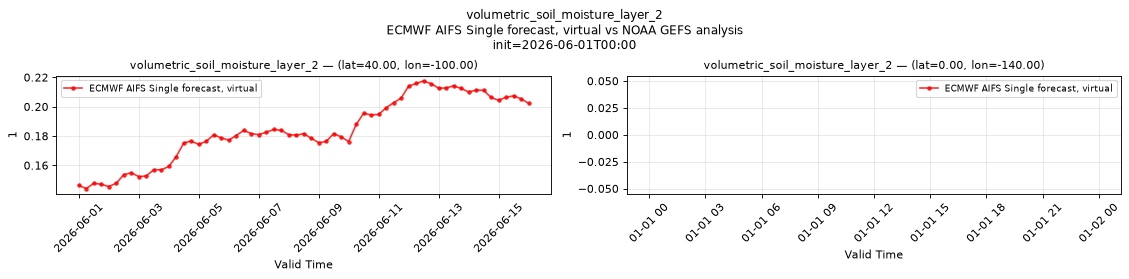
Temporal — init=2026-06-01T00:00
| Source | min | mean | max |
|---|---|---|---|
| P1 Validation | 0.1442 | 0.1839 | 0.2175 |
| P2 Validation | n/a | n/a | n/a |
Availability — 2281 of 3598 positions complete (incomplete 2024-04-01T00:00 → 2025-02-24T00:00)
wind_u_100m
Metadata
| Field | Value |
|---|---|
| units | m s-1 |
| long_name | 100 metre U wind component |
| short_name | 100u |
| standard_name | eastward_wind |
| step_type | instant |
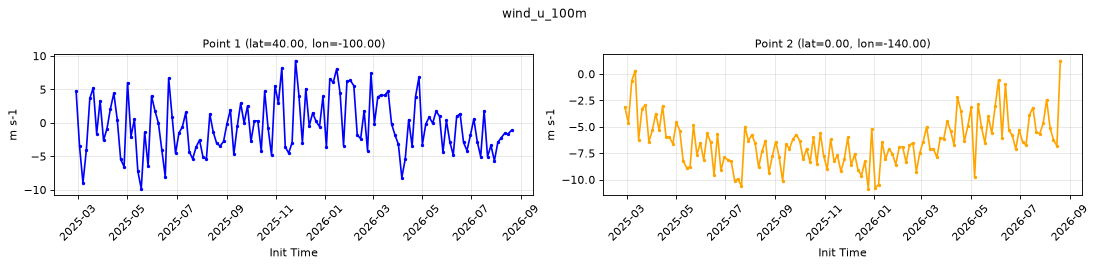
Point time series — 2024-04-01T00:00 - 2026-09-17T06:00, sampled lead=6h
| Point | min | mean | max |
|---|---|---|---|
| P1 | -9.865 | -0.4812 | 9.305 |
| P2 | -10.88 | -6.276 | 1.269 |
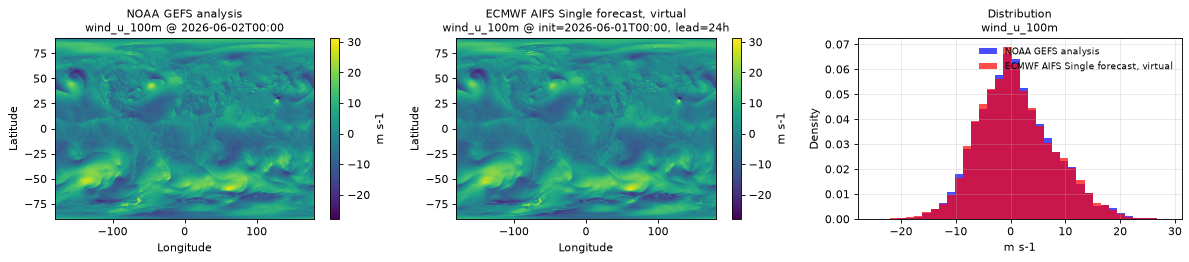
Spatial — init=2026-06-01T00:00, lead=24h (reference at 2026-06-02T00:00)
| Source | min | mean | max |
|---|---|---|---|
| Validation | -27.93 | 0.9516 | 29.45 |
| Reference | -27.25 | 0.9548 | 31.25 |
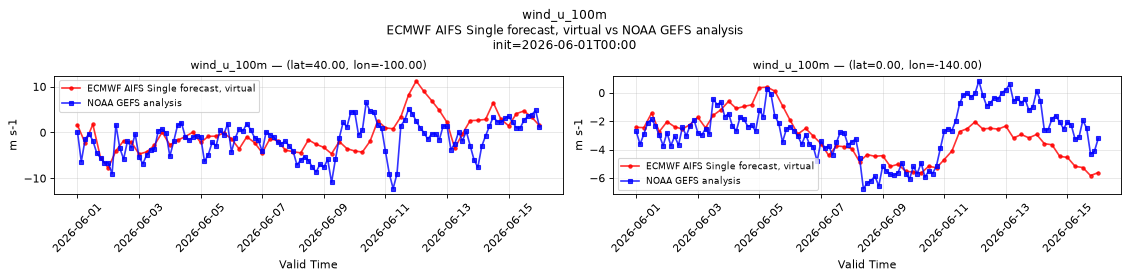
Temporal — init=2026-06-01T00:00
| Source | min | mean | max |
|---|---|---|---|
| P1 Validation | -7.743 | -0.2964 | 11.24 |
| P1 Reference | -12.25 | -1.519 | 6.562 |
| P2 Validation | -5.832 | -3.125 | 0.4006 |
| P2 Reference | -6.75 | -2.74 | 0.8359 |
Availability — 2281 of 3598 positions complete (incomplete 2024-04-01T00:00 → 2025-02-24T00:00)
wind_u_10m
Metadata
| Field | Value |
|---|---|
| units | m s-1 |
| long_name | 10 metre U wind component |
| short_name | 10u |
| standard_name | eastward_wind |
| step_type | instant |
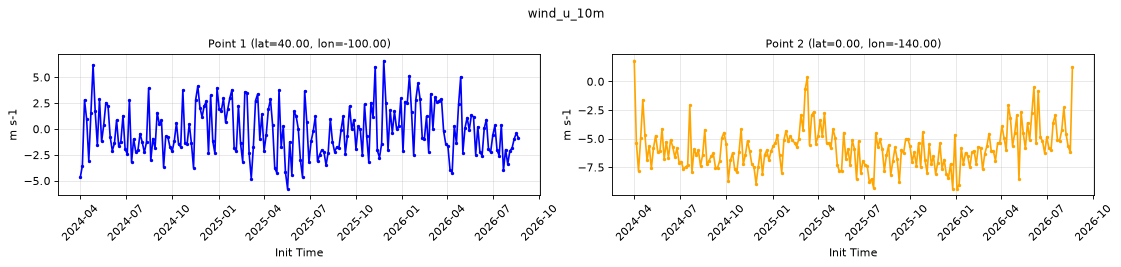
Point time series — 2024-04-01T00:00 - 2026-09-17T06:00, sampled lead=6h
| Point | min | mean | max |
|---|---|---|---|
| P1 | -5.785 | -0.2016 | 6.606 |
| P2 | -9.396 | -5.748 | 1.83 |
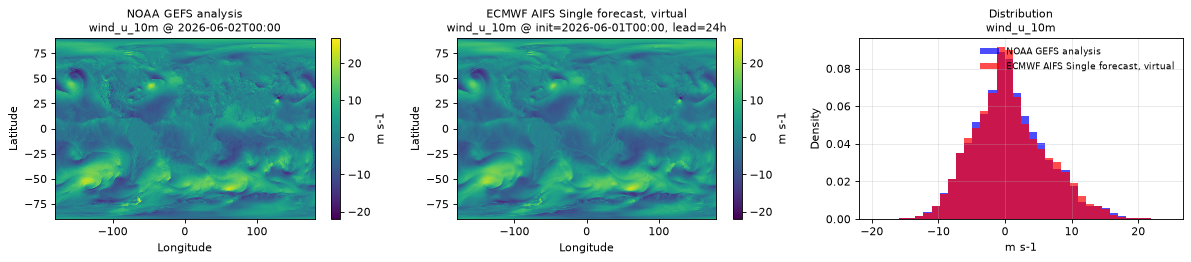
Spatial — init=2026-06-01T00:00, lead=24h (reference at 2026-06-02T00:00)
| Source | min | mean | max |
|---|---|---|---|
| Validation | -20.76 | 0.712 | 22.91 |
| Reference | -22 | 0.6821 | 26.75 |
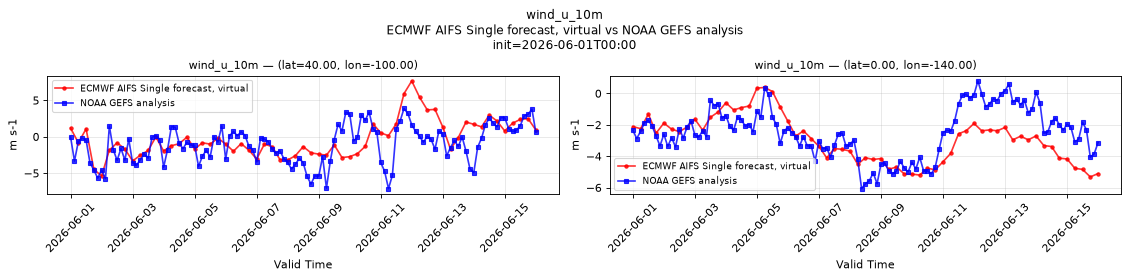
Temporal — init=2026-06-01T00:00
| Source | min | mean | max |
|---|---|---|---|
| P1 Validation | -5.374 | -0.3105 | 7.652 |
| P1 Reference | -7.125 | -1.066 | 3.875 |
| P2 Validation | -5.318 | -2.904 | 0.382 |
| P2 Reference | -6.062 | -2.469 | 0.7969 |
Availability — 3598 of 3598 positions complete
wind_v_100m
Metadata
| Field | Value |
|---|---|
| units | m s-1 |
| long_name | 100 metre V wind component |
| short_name | 100v |
| standard_name | northward_wind |
| step_type | instant |
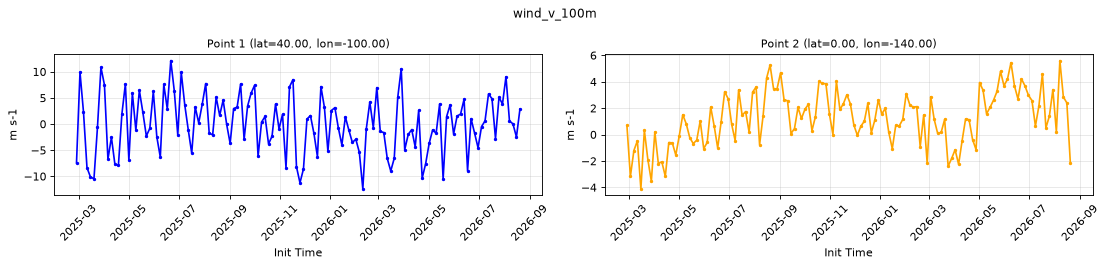
Point time series — 2024-04-01T00:00 - 2026-09-17T06:00, sampled lead=6h
| Point | min | mean | max |
|---|---|---|---|
| P1 | -12.4 | 0.08619 | 12.13 |
| P2 | -4.109 | 1.383 | 7.414 |
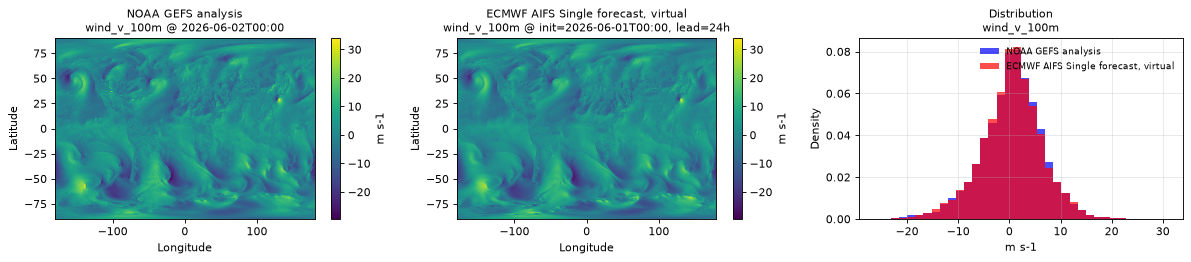
Spatial — init=2026-06-01T00:00, lead=24h (reference at 2026-06-02T00:00)
| Source | min | mean | max |
|---|---|---|---|
| Validation | -26.07 | 0.4197 | 31.36 |
| Reference | -29.5 | 0.4874 | 34 |
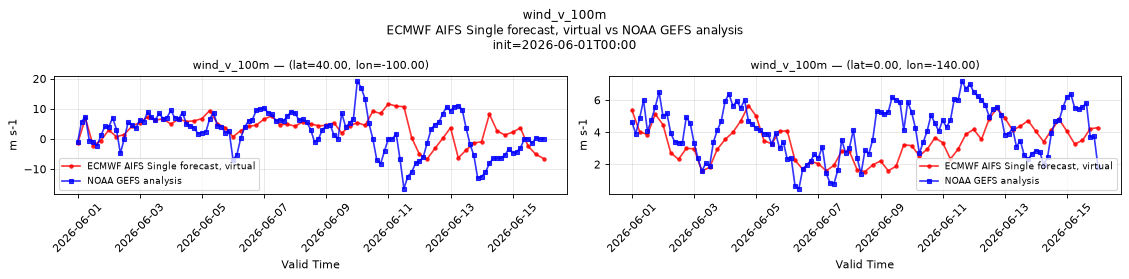
Temporal — init=2026-06-01T00:00
| Source | min | mean | max |
|---|---|---|---|
| P1 Validation | -6.664 | 3.262 | 11.62 |
| P1 Reference | -16.5 | 2.286 | 19.25 |
| P2 Validation | 1.548 | 3.375 | 5.657 |
| P2 Reference | 0.4883 | 4.102 | 7.188 |
Availability — 2281 of 3598 positions complete (incomplete 2024-04-01T00:00 → 2025-02-24T00:00)
wind_v_10m
Metadata
| Field | Value |
|---|---|
| units | m s-1 |
| long_name | 10 metre V wind component |
| short_name | 10v |
| standard_name | northward_wind |
| step_type | instant |
Point time series — 2024-04-01T00:00 - 2026-09-17T06:00, sampled lead=6h
| Point | min | mean | max |
|---|---|---|---|
| P1 | -8.982 | 0.1604 | 9.385 |
| P2 | -4.059 | 1.152 | 6.71 |
Spatial — init=2026-06-01T00:00, lead=24h (reference at 2026-06-02T00:00)
| Source | min | mean | max |
|---|---|---|---|
| Validation | -18.82 | 0.4338 | 23.38 |
| Reference | -23.75 | 0.469 | 27 |
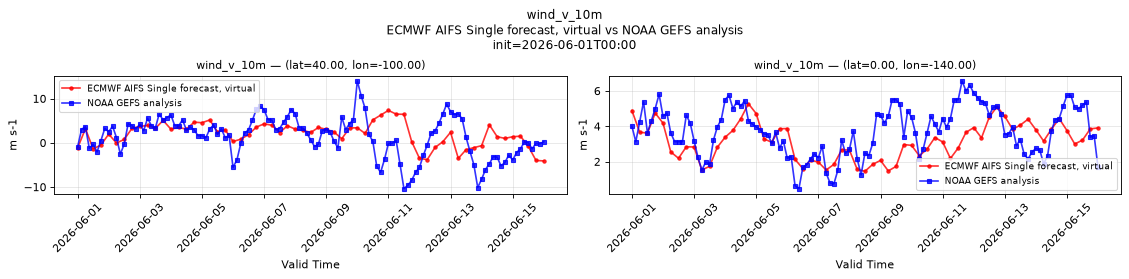
Temporal — init=2026-06-01T00:00
| Source | min | mean | max |
|---|---|---|---|
| P1 Validation | -4.11 | 1.954 | 7.333 |
| P1 Reference | -10.38 | 1.352 | 14 |
| P2 Validation | 1.456 | 3.156 | 5.274 |
| P2 Reference | 0.4727 | 3.734 | 6.562 |
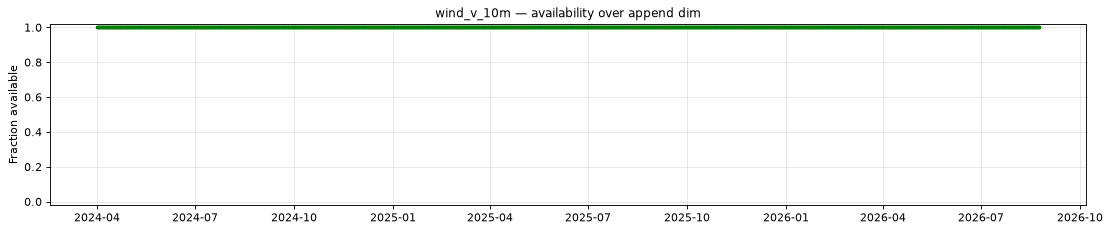
Availability — 3598 of 3598 positions complete