Google WeatherNext 2 historical forecast, virtual validation report
This dataset validation report plots a sample of values from the Google WeatherNext 2 historical forecast, virtual dataset over time and across space, comparing where possible to a previously validated reference dataset. It also reports the quantity of unavailable values and their associated timestamps. These analyses are one layer of a multi-layered dataset validation process we perform at dynamical.org and also provide users a preview of the dataset contents.
Report generation start time: 2026-08-27T19:23:57 UTC
Summary
This dataset has been reviewed and is ready for use. Note that longitudes run 0 to 360 and the horizontal dimensions are named y and x.
What looks good
- Every expected source file is present across the whole archive. All 4,384 initialization times were probed exhaustively — no gaps, in any variable, in any year.
- Every sampled reference decoded cleanly, across 8 evenly spaced regions of the archive.
- Unit conversions are correct. Geopotential height was cross-checked independently against NOAA GEFS's own 500 hPa height field and agrees to within a few metres.
- The three annual source archives splice seamlessly — no step changes in the full-period series, which is where a units or precision change at the source would appear.
- Fields are meteorologically sound — a Southern Hemisphere winter jet stronger than the summer Northern Hemisphere one, an Antarctic polar vortex, moisture along the ITCZ and storm tracks, and land points with a strong diurnal cycle against nearly flat ocean points.
- Comparisons against the reference track well for the six variables NOAA GEFS also carries.
Review notes
- Longitudes run 0 to 360, and the horizontal dimensions are named
yandxrather thanlatitudeandlongitude. This archive references its source files in place, so it keeps the source grid's own labelling.yholds latitude values ascending from south to north andxholds longitude from 0 to 360; a point at 100°W is addressed as 260.
Variables needing care
- Specific humidity and total precipitation contain small negative values. It's reasonable to clamp them to 0.
- Sea surface temperature is a daily field. It steps once every 24 hours.
Datasets
| Role | Name | ID | Version | URL |
|---|---|---|---|---|
| Validation | Google WeatherNext 2 historical forecast, virtual | google-weathernext2-forecast-historical-virtual |
v0.1.0 |
https://google-weathernext2.r2.dynamical.org/google-weathernext2-forecast-historical-virtual/v0.1.0.icechunk |
| Reference | NOAA GEFS analysis | noaa-gefs-analysis |
0.1.2 |
s3://dynamical-noaa-gefs/noaa-gefs-analysis/v0.1.2.icechunk/ |
Run parameters
| Parameter | Value |
|---|---|
| Validation dataset type | forecast |
| Validation time range | init_time 2022-01-01T00:00 → 2024-12-31T18:00 |
| Reference time range | time 2000-01-01T00:00 → 2026-08-27T12:00 |
| Point 1 | lat=40.0000, lon=260.0000 |
| Point 2 | lat=-20.0000, lon=220.0000 |
| Ensemble member | 8 |
| Spatial comparison time | init=2023-07-01T00:00, lead=24h (reference at 2023-07-02T00:00) |
| Timeseries period | init=2023-07-01T00:00 |
| Vertical level | override 500 |
| Store type | virtual — availability manifest-probed; value series sampled |
Availability
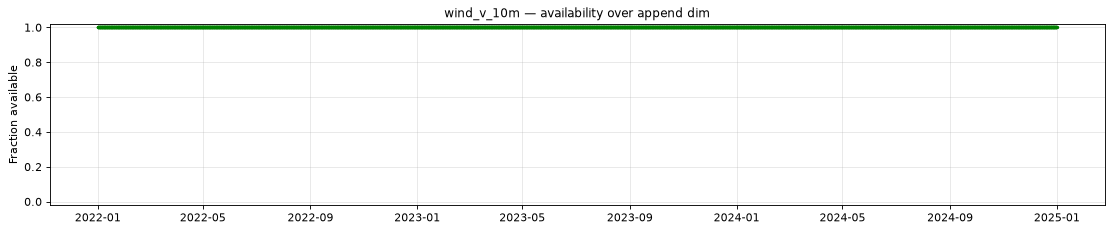
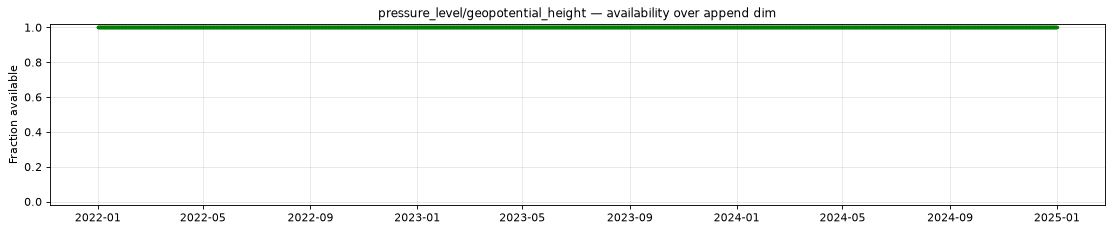
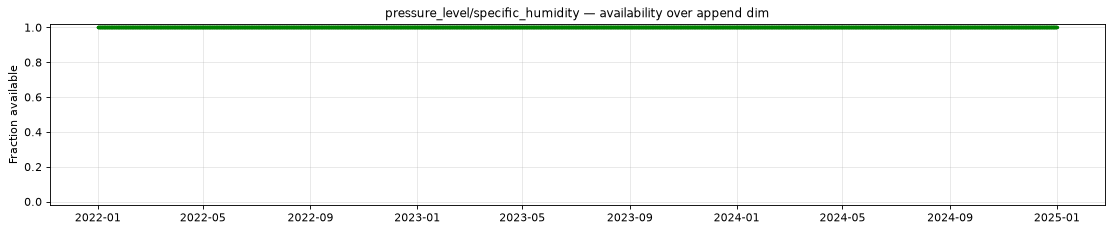
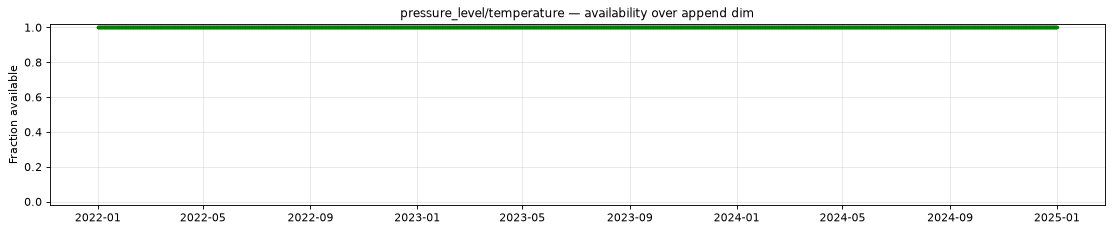
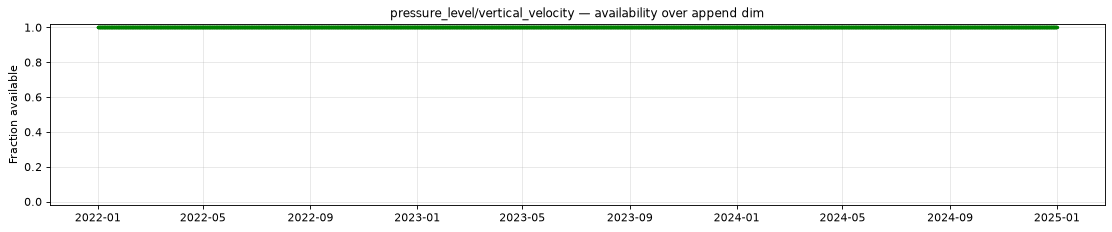
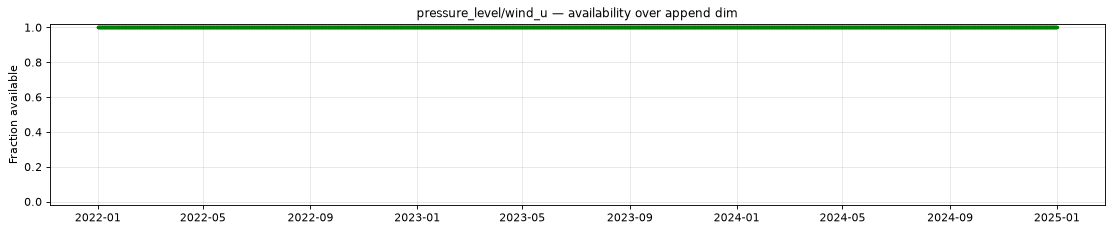
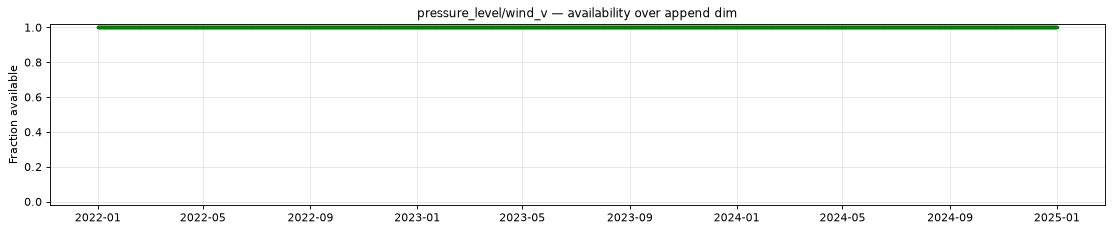
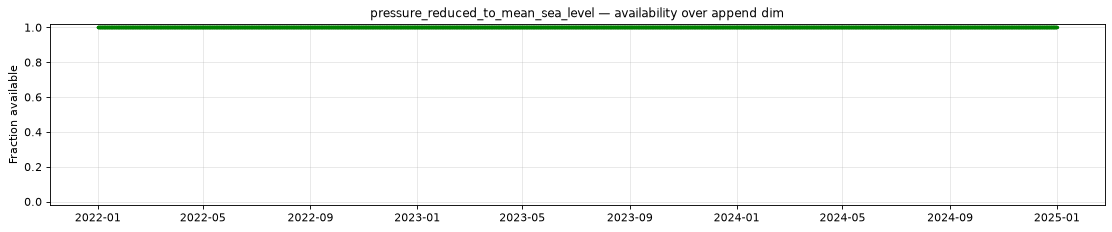
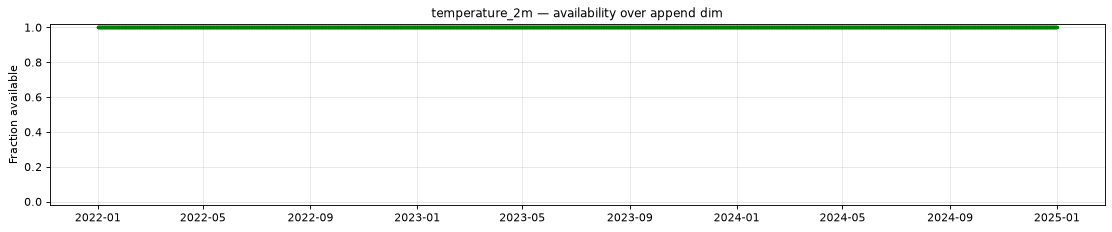
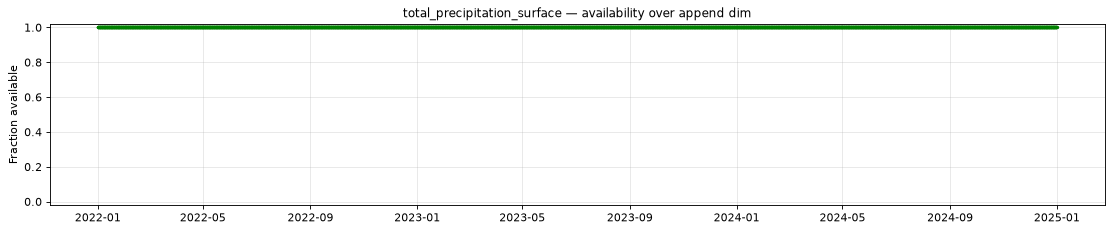
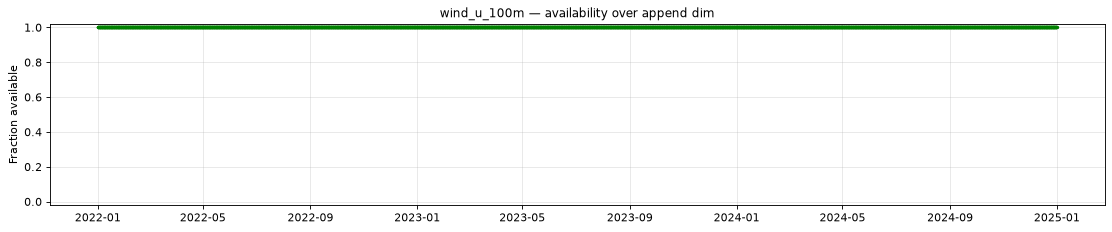
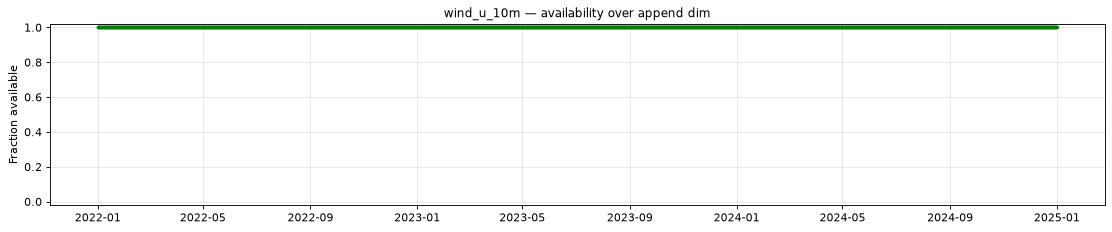
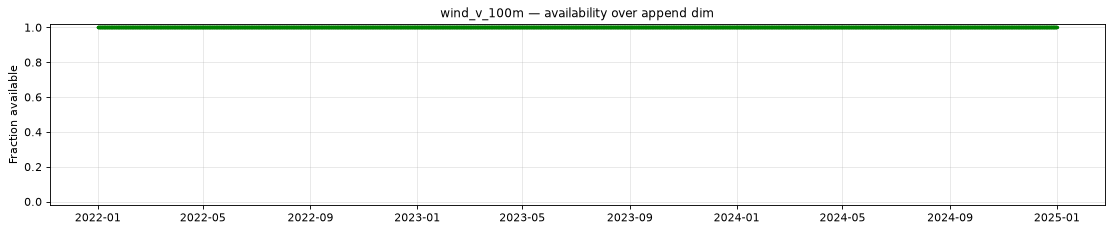
The plot below shows the availability of each variable over time — light red marks unavailable data, dark green marks present data.
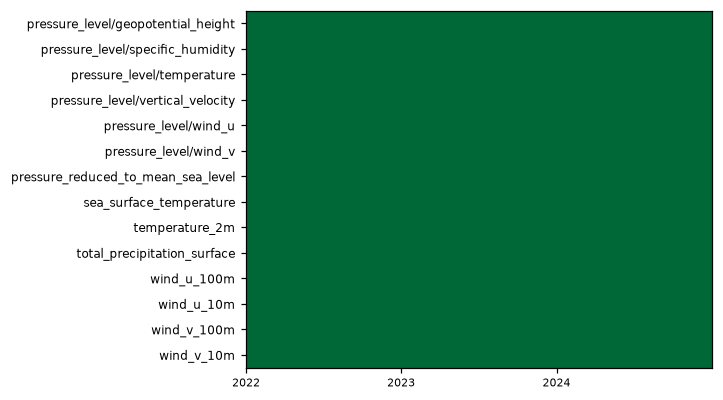
Every variable is complete at every scanned position.
Decode health
560 references decoded successfully, sampled across 8 of 4384 append-dim regions, 5 leads and 3 levels per group variable.
Per-variable details
pressure_level/geopotential_height
Metadata
| Field | Value |
|---|---|
| units | m |
| long_name | Geopotential height |
| short_name | gh |
| standard_name | geopotential_height |
| step_type | instant |
| sampled level | pressure_level=500 |
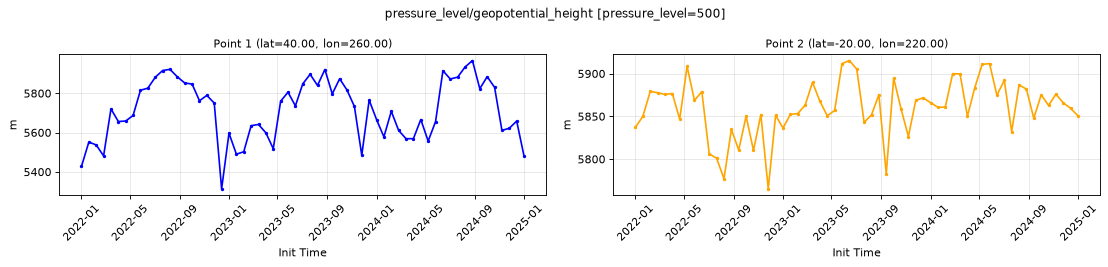
Point time series — 2022-01-01T00:00 - 2024-12-31T18:00, sampled lead=12h, member=0, pressure_level=500
| Point | min | mean | max |
|---|---|---|---|
| P1 | 5313 | 5715 | 5967 |
| P2 | 5765 | 5860 | 5915 |
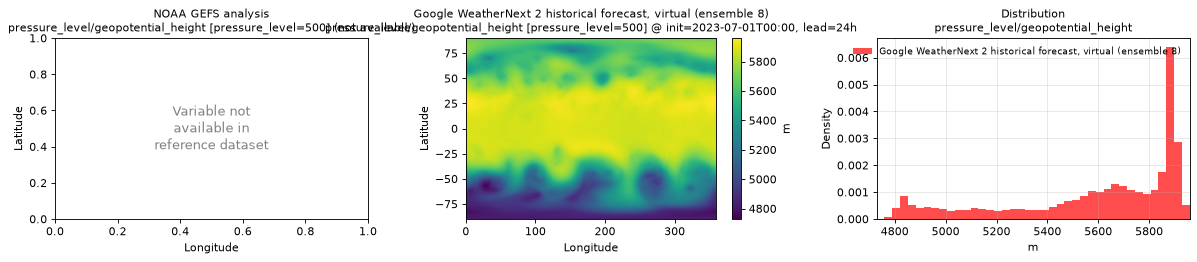
Spatial — init=2023-07-01T00:00, lead=24h (reference not available)
| Source | min | mean | max |
|---|---|---|---|
| Validation | 4729 | 5589 | 5959 |
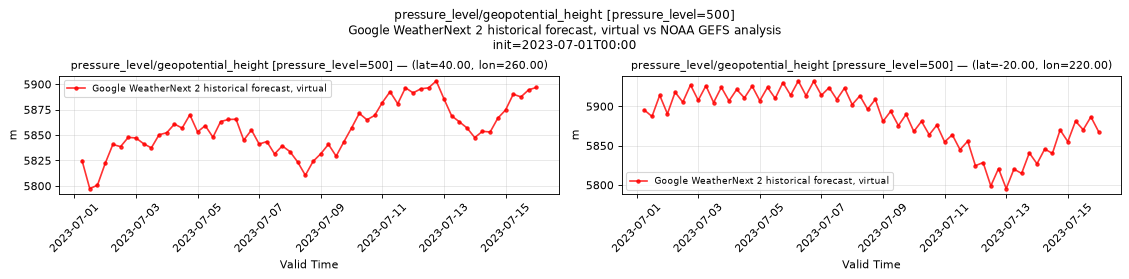
Temporal — init=2023-07-01T00:00
| Source | min | mean | max |
|---|---|---|---|
| P1 Validation | 5797 | 5856 | 5903 |
| P2 Validation | 5795 | 5884 | 5932 |
Availability — 4384 of 4384 positions complete
pressure_level/specific_humidity
Metadata
| Field | Value |
|---|---|
| units | 1 |
| long_name | Specific humidity |
| short_name | q |
| standard_name | specific_humidity |
| step_type | instant |
| sampled level | pressure_level=500 |
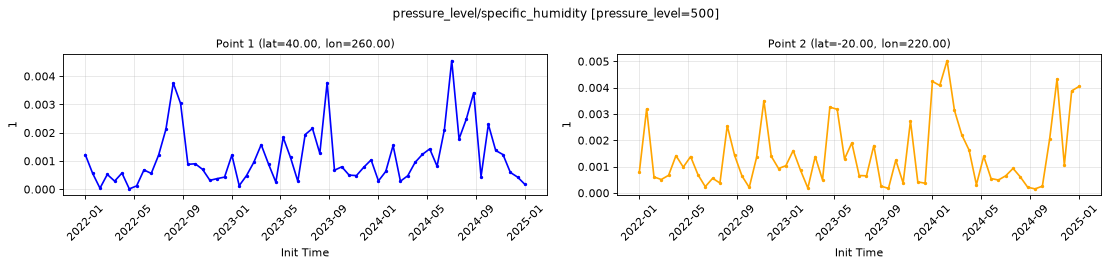
Point time series — 2022-01-01T00:00 - 2024-12-31T18:00, sampled lead=12h, member=0, pressure_level=500
| Point | min | mean | max |
|---|---|---|---|
| P1 | 1.407e-05 | 0.001131 | 0.004552 |
| P2 | 0.0001555 | 0.001453 | 0.005028 |
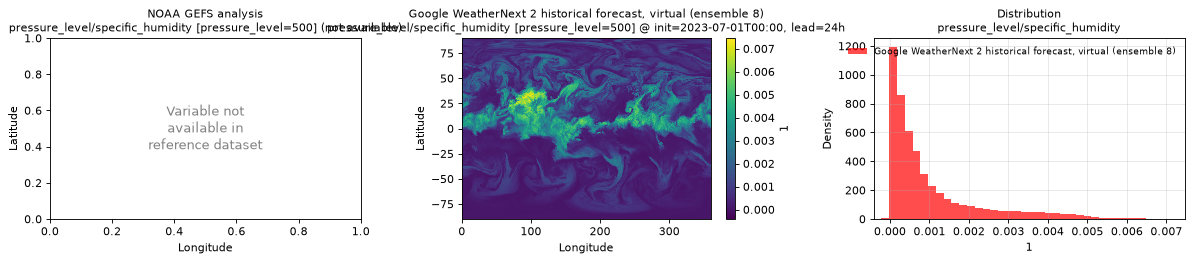
Spatial — init=2023-07-01T00:00, lead=24h (reference not available)
| Source | min | mean | max |
|---|---|---|---|
| Validation | -0.000411 | 0.001022 | 0.007461 |
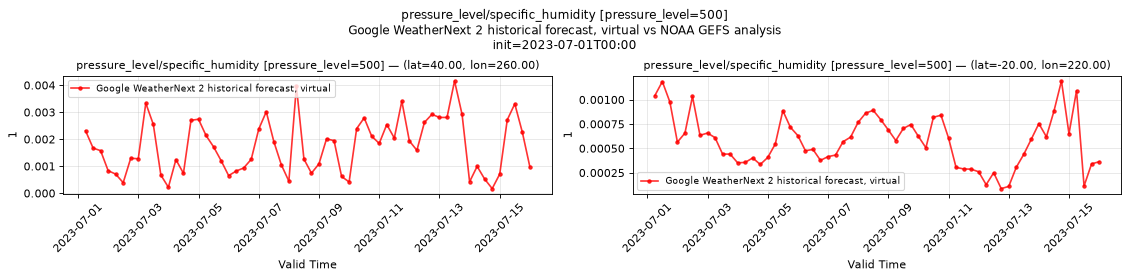
Temporal — init=2023-07-01T00:00
| Source | min | mean | max |
|---|---|---|---|
| P1 Validation | 0.0001706 | 0.001747 | 0.004158 |
| P2 Validation | 8.686e-05 | 0.0005791 | 0.001193 |
Availability — 4384 of 4384 positions complete
pressure_level/temperature
Metadata
| Field | Value |
|---|---|
| units | degree_Celsius |
| long_name | Temperature |
| short_name | t |
| standard_name | air_temperature |
| step_type | instant |
| sampled level | pressure_level=500 |
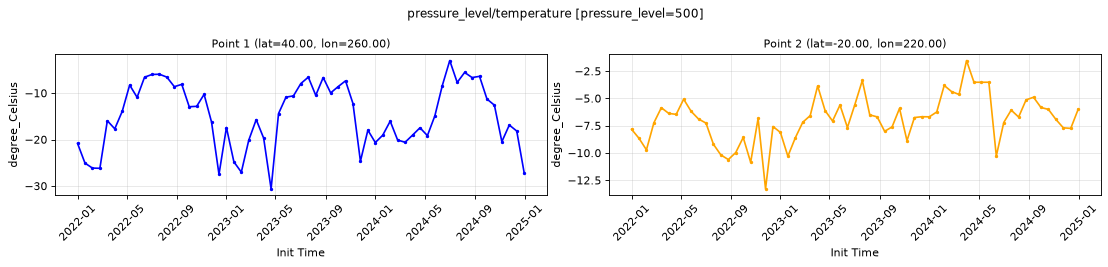
Point time series — 2022-01-01T00:00 - 2024-12-31T18:00, sampled lead=12h, member=0, pressure_level=500
| Point | min | mean | max |
|---|---|---|---|
| P1 | -30.63 | -14.79 | -2.998 |
| P2 | -13.3 | -6.893 | -1.541 |
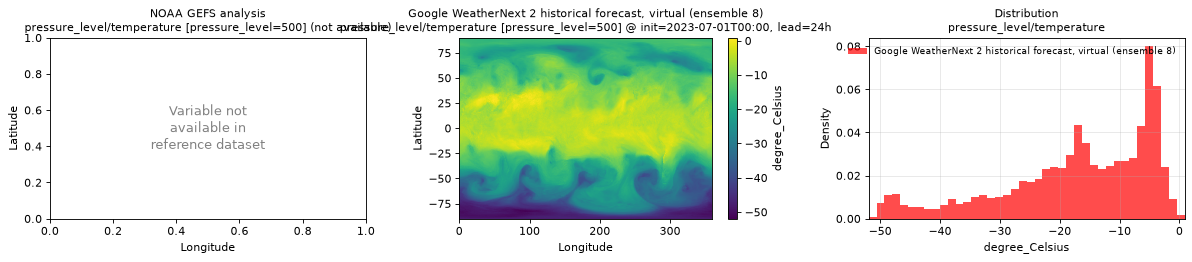
Spatial — init=2023-07-01T00:00, lead=24h (reference not available)
| Source | min | mean | max |
|---|---|---|---|
| Validation | -51.94 | -17.19 | 0.8624 |
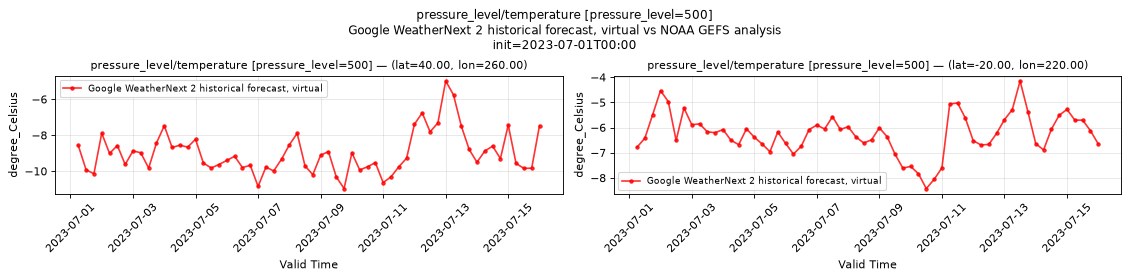
Temporal — init=2023-07-01T00:00
| Source | min | mean | max |
|---|---|---|---|
| P1 Validation | -10.97 | -8.983 | -4.982 |
| P2 Validation | -8.426 | -6.241 | -4.148 |
Availability — 4384 of 4384 positions complete
pressure_level/vertical_velocity
Metadata
| Field | Value |
|---|---|
| units | Pa s-1 |
| long_name | Vertical velocity |
| short_name | w |
| standard_name | lagrangian_tendency_of_air_pressure |
| step_type | instant |
| sampled level | pressure_level=500 |
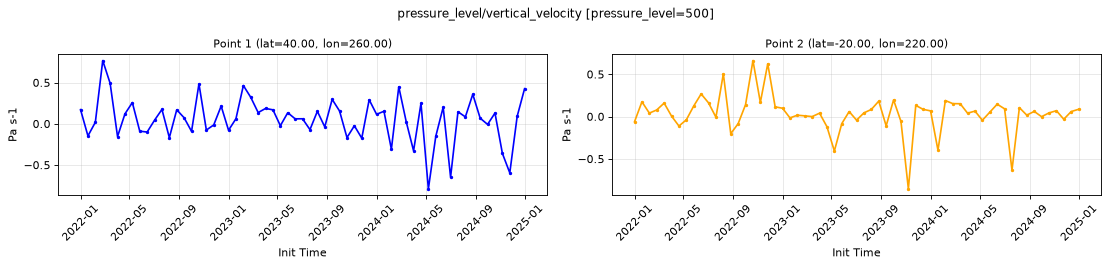
Point time series — 2022-01-01T00:00 - 2024-12-31T18:00, sampled lead=12h, member=0, pressure_level=500
| Point | min | mean | max |
|---|---|---|---|
| P1 | -0.791 | 0.05462 | 0.7673 |
| P2 | -0.8548 | 0.03678 | 0.6614 |
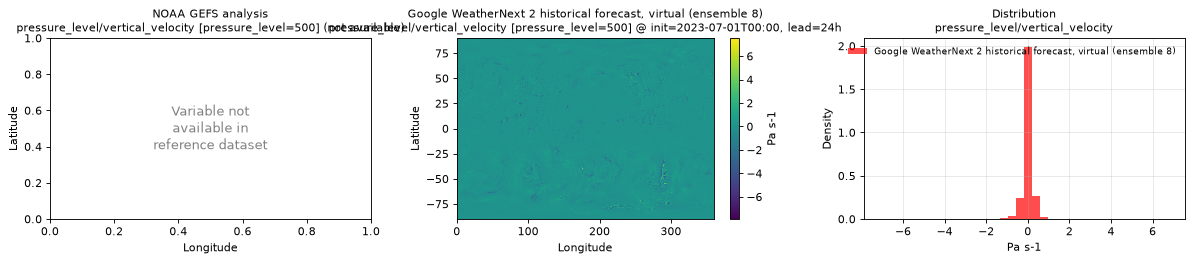
Spatial — init=2023-07-01T00:00, lead=24h (reference not available)
| Source | min | mean | max |
|---|---|---|---|
| Validation | -7.896 | 0.004743 | 7.541 |
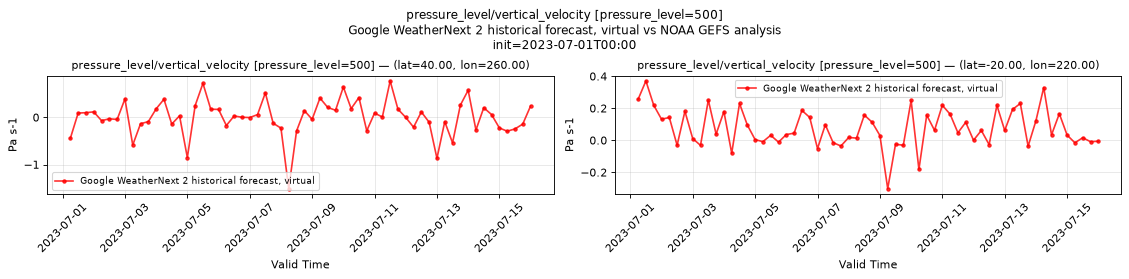
Temporal — init=2023-07-01T00:00
| Source | min | mean | max |
|---|---|---|---|
| P1 Validation | -1.511 | -0.0031 | 0.7715 |
| P2 Validation | -0.3018 | 0.07585 | 0.3705 |
Availability — 4384 of 4384 positions complete
pressure_level/wind_u
Metadata
| Field | Value |
|---|---|
| units | m s-1 |
| long_name | U component of wind |
| short_name | u |
| standard_name | eastward_wind |
| step_type | instant |
| sampled level | pressure_level=500 |
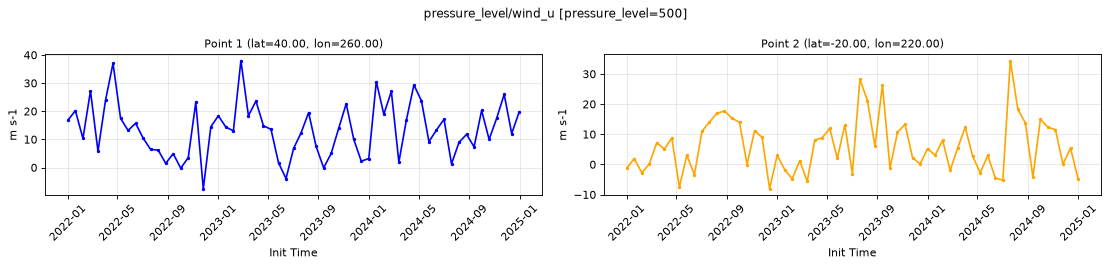
Point time series — 2022-01-01T00:00 - 2024-12-31T18:00, sampled lead=12h, member=0, pressure_level=500
| Point | min | mean | max |
|---|---|---|---|
| P1 | -7.575 | 13.59 | 38.01 |
| P2 | -8.092 | 6.228 | 34.44 |
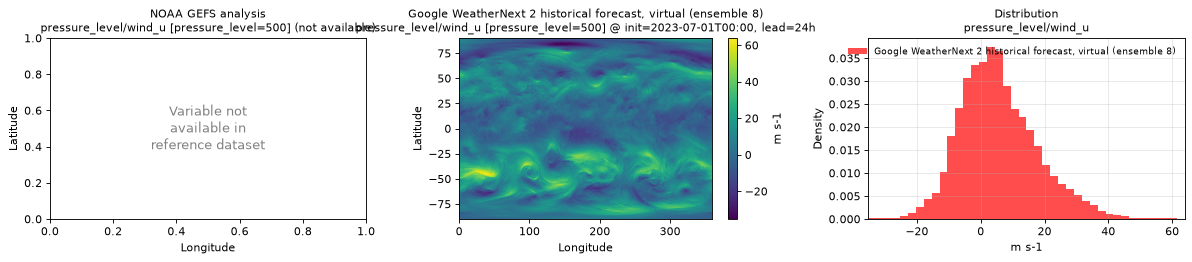
Spatial — init=2023-07-01T00:00, lead=24h (reference not available)
| Source | min | mean | max |
|---|---|---|---|
| Validation | -35.22 | 5.615 | 63.91 |
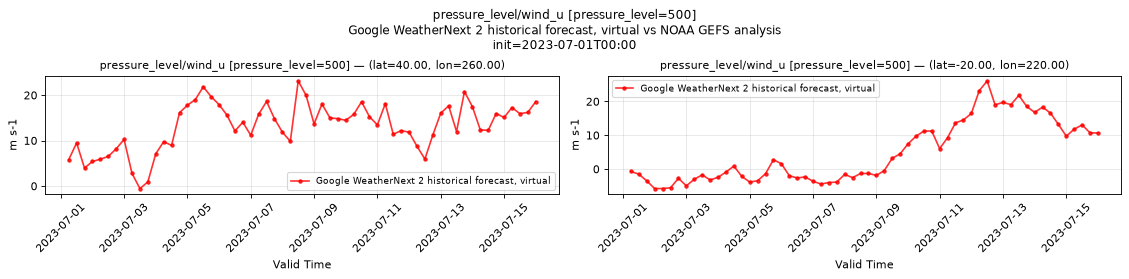
Temporal — init=2023-07-01T00:00
| Source | min | mean | max |
|---|---|---|---|
| P1 Validation | -0.5637 | 13.16 | 23.13 |
| P2 Validation | -5.796 | 4.933 | 26.08 |
Availability — 4384 of 4384 positions complete
pressure_level/wind_v
Metadata
| Field | Value |
|---|---|
| units | m s-1 |
| long_name | V component of wind |
| short_name | v |
| standard_name | northward_wind |
| step_type | instant |
| sampled level | pressure_level=500 |
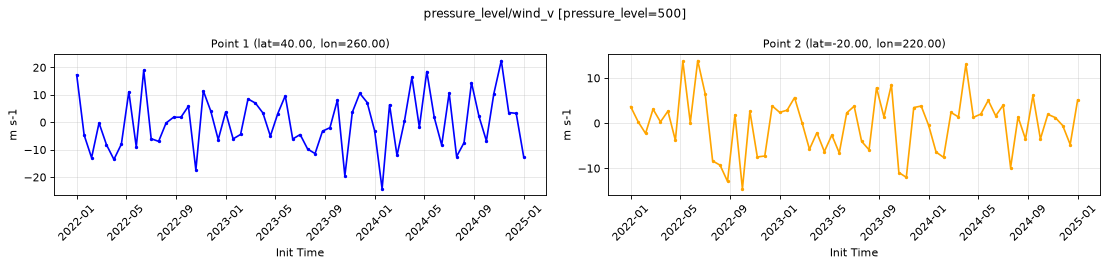
Point time series — 2022-01-01T00:00 - 2024-12-31T18:00, sampled lead=12h, member=0, pressure_level=500
| Point | min | mean | max |
|---|---|---|---|
| P1 | -24.27 | -0.08454 | 22.52 |
| P2 | -14.55 | -0.2814 | 13.87 |
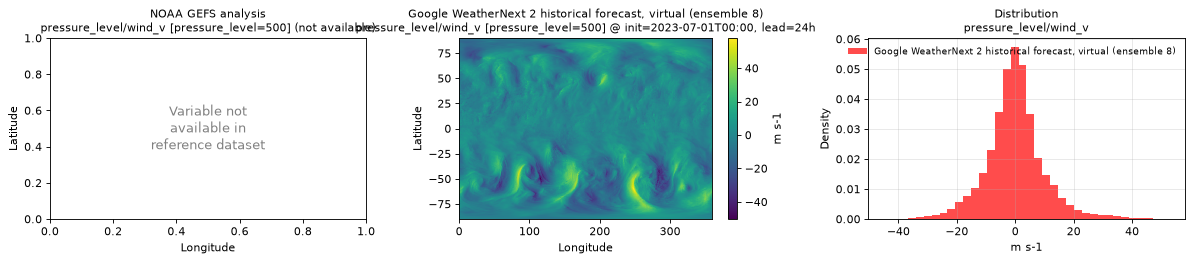
Spatial — init=2023-07-01T00:00, lead=24h (reference not available)
| Source | min | mean | max |
|---|---|---|---|
| Validation | -50.29 | -0.01979 | 57.97 |
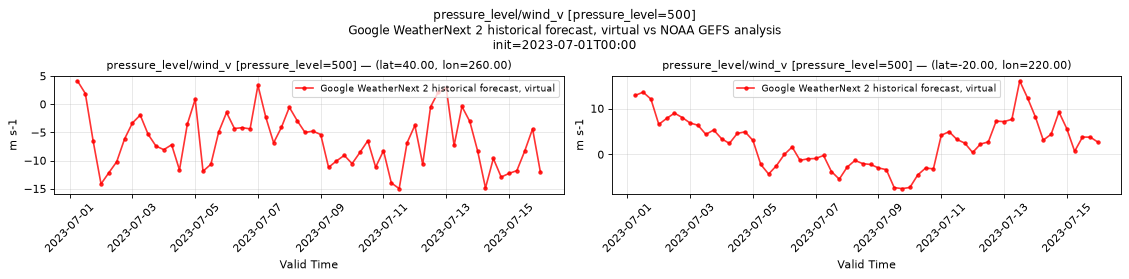
Temporal — init=2023-07-01T00:00
| Source | min | mean | max |
|---|---|---|---|
| P1 Validation | -14.99 | -6.47 | 4.115 |
| P2 Validation | -7.44 | 2.606 | 16 |
Availability — 4384 of 4384 positions complete
pressure_reduced_to_mean_sea_level
Metadata
| Field | Value |
|---|---|
| units | Pa |
| long_name | Pressure reduced to MSL |
| short_name | prmsl |
| standard_name | air_pressure_at_mean_sea_level |
| step_type | instant |
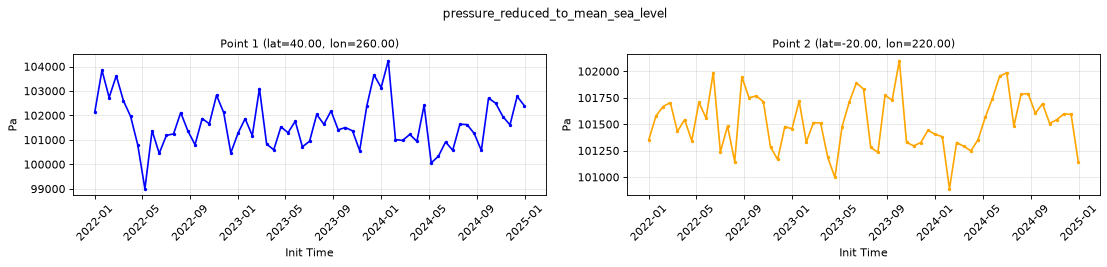
Point time series — 2022-01-01T00:00 - 2024-12-31T18:00, sampled lead=12h, member=0
| Point | min | mean | max |
|---|---|---|---|
| P1 | 9.9e+04 | 1.017e+05 | 1.042e+05 |
| P2 | 1.009e+05 | 1.015e+05 | 1.021e+05 |
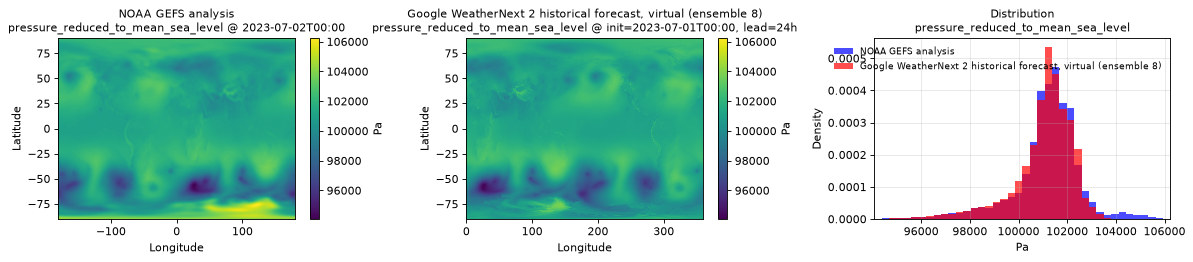
Spatial — init=2023-07-01T00:00, lead=24h (reference at 2023-07-02T00:00)
| Source | min | mean | max |
|---|---|---|---|
| Validation | 9.409e+04 | 1.01e+05 | 1.039e+05 |
| Reference | 9.408e+04 | 1.012e+05 | 1.062e+05 |
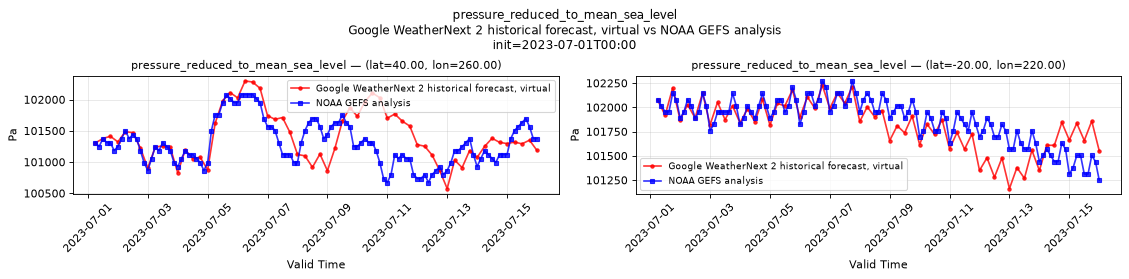
Temporal — init=2023-07-01T00:00
| Source | min | mean | max |
|---|---|---|---|
| P1 Validation | 1.006e+05 | 1.014e+05 | 1.023e+05 |
| P1 Reference | 1.007e+05 | 1.013e+05 | 1.021e+05 |
| P2 Validation | 1.012e+05 | 1.018e+05 | 1.022e+05 |
| P2 Reference | 1.012e+05 | 1.019e+05 | 1.023e+05 |
Availability — 4384 of 4384 positions complete
sea_surface_temperature
Metadata
| Field | Value |
|---|---|
| units | degree_Celsius |
| long_name | Sea surface temperature |
| short_name | sst |
| standard_name | sea_surface_temperature |
| step_type | instant |
| comment | NaN over land where sea surface temperature does not apply. |
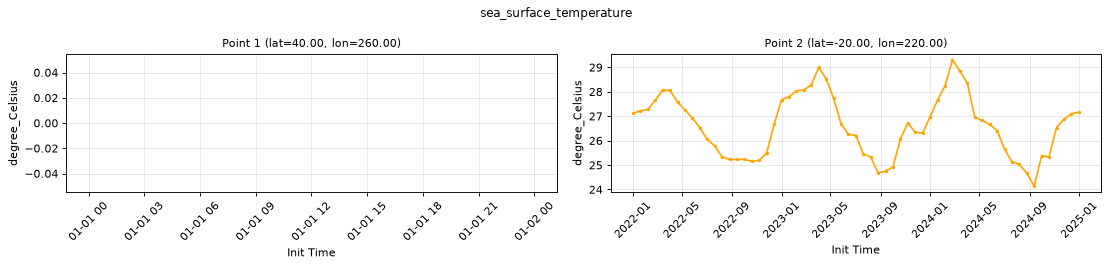
Point time series — 2022-01-01T00:00 - 2024-12-31T18:00, sampled lead=12h, member=0
| Point | min | mean | max |
|---|---|---|---|
| P1 | n/a | n/a | n/a |
| P2 | 24.14 | 26.61 | 29.3 |
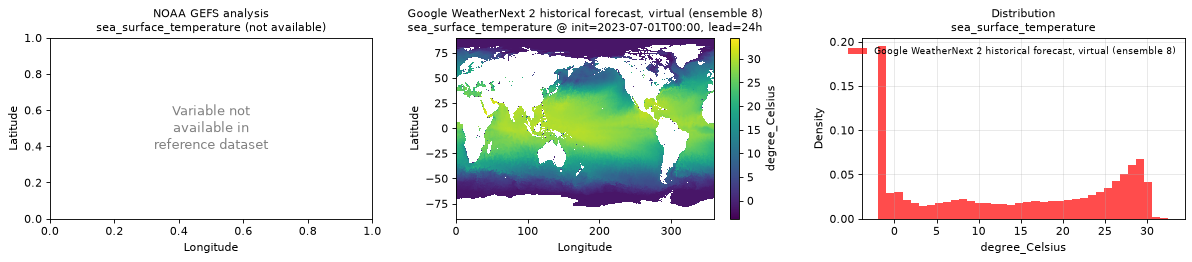
Spatial — init=2023-07-01T00:00, lead=24h (reference not available)
| Source | min | mean | max |
|---|---|---|---|
| Validation | -3.827 | 14.11 | 34.47 |
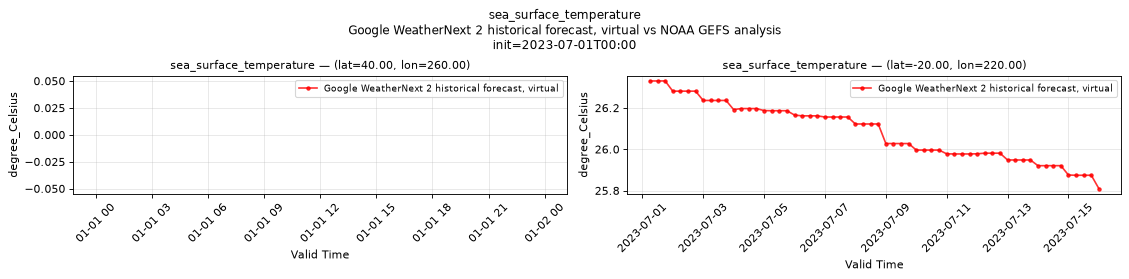
Temporal — init=2023-07-01T00:00
| Source | min | mean | max |
|---|---|---|---|
| P1 Validation | n/a | n/a | n/a |
| P2 Validation | 25.81 | 26.08 | 26.33 |
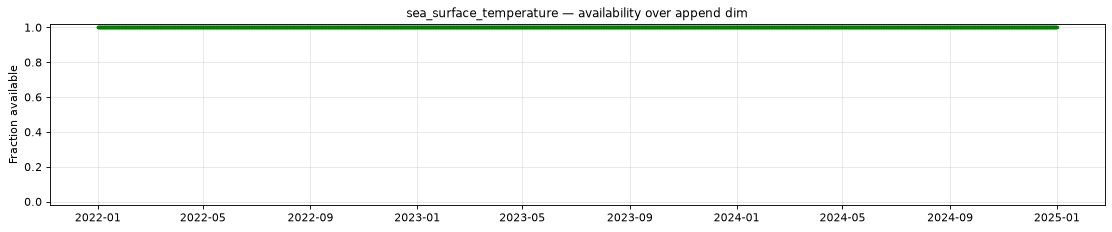
Availability — 4384 of 4384 positions complete
temperature_2m
Metadata
| Field | Value |
|---|---|
| units | degree_Celsius |
| long_name | 2 metre temperature |
| short_name | 2t |
| standard_name | air_temperature |
| step_type | instant |
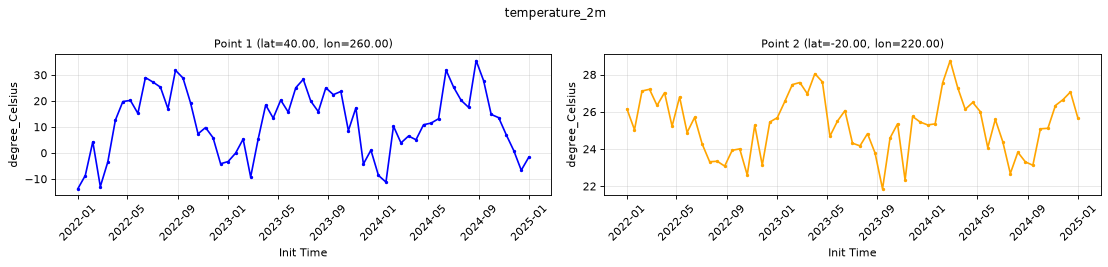
Point time series — 2022-01-01T00:00 - 2024-12-31T18:00, sampled lead=12h, member=0
| Point | min | mean | max |
|---|---|---|---|
| P1 | -13.82 | 11.59 | 35.54 |
| P2 | 21.86 | 25.32 | 28.76 |
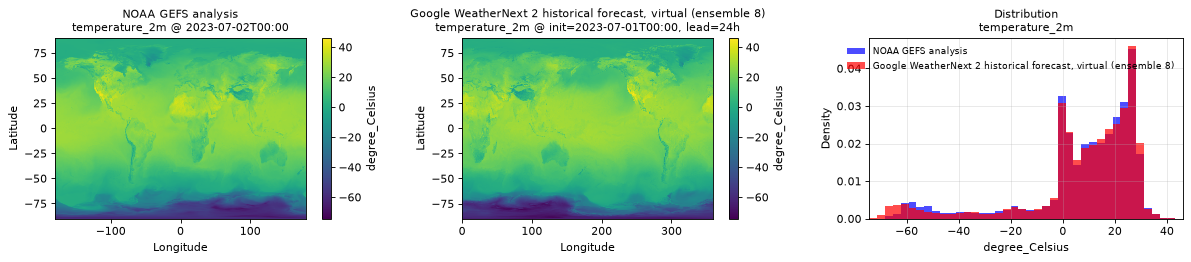
Spatial — init=2023-07-01T00:00, lead=24h (reference at 2023-07-02T00:00)
| Source | min | mean | max |
|---|---|---|---|
| Validation | -74.34 | 7.624 | 46.24 |
| Reference | -69 | 7.809 | 44.5 |
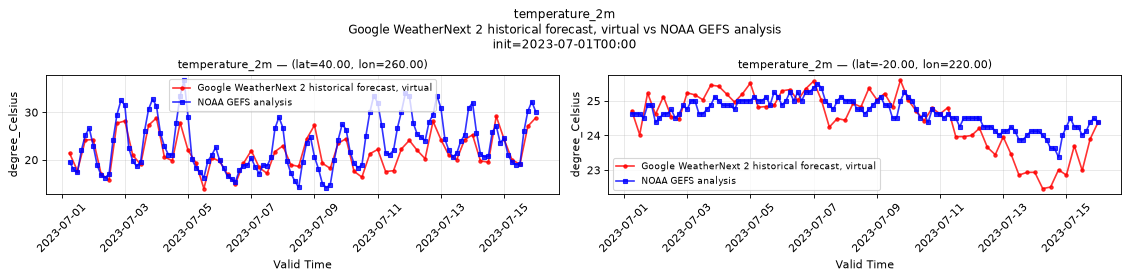
Temporal — init=2023-07-01T00:00
| Source | min | mean | max |
|---|---|---|---|
| P1 Validation | 13.95 | 21.6 | 29.18 |
| P1 Reference | 14.12 | 23.3 | 36.75 |
| P2 Validation | 22.47 | 24.47 | 25.59 |
| P2 Reference | 23.38 | 24.65 | 25.5 |
Availability — 4384 of 4384 positions complete
total_precipitation_surface
Metadata
| Field | Value |
|---|---|
| units | kg m-2 |
| long_name | Total precipitation |
| short_name | tp |
| standard_name | precipitation_amount |
| step_type | accum |
| comment | Accumulated over a six-hour forecast interval. Small negative values are raw model artifacts; set values < 0 to zero. |
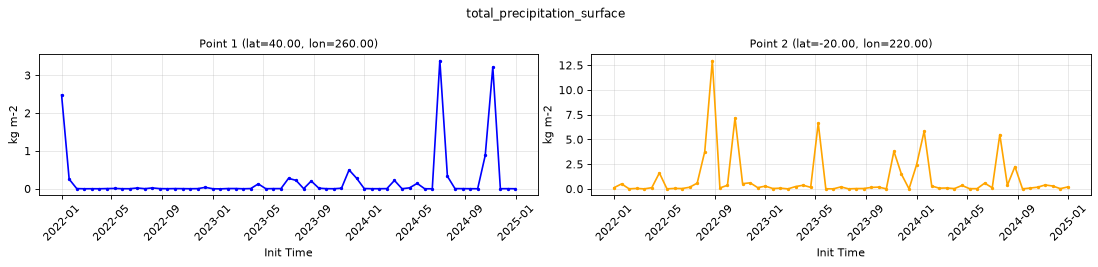
Point time series — 2022-01-01T00:00 - 2024-12-31T18:00, sampled lead=12h, member=0
| Point | min | mean | max |
|---|---|---|---|
| P1 | -0.004472 | 0.2074 | 3.388 |
| P2 | -0.002363 | 1.008 | 12.97 |
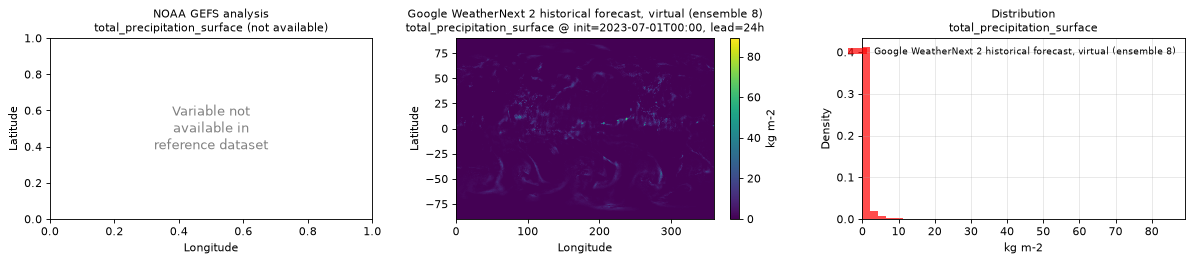
Spatial — init=2023-07-01T00:00, lead=24h (reference not available)
| Source | min | mean | max |
|---|---|---|---|
| Validation | -0.06456 | 0.6258 | 89.09 |
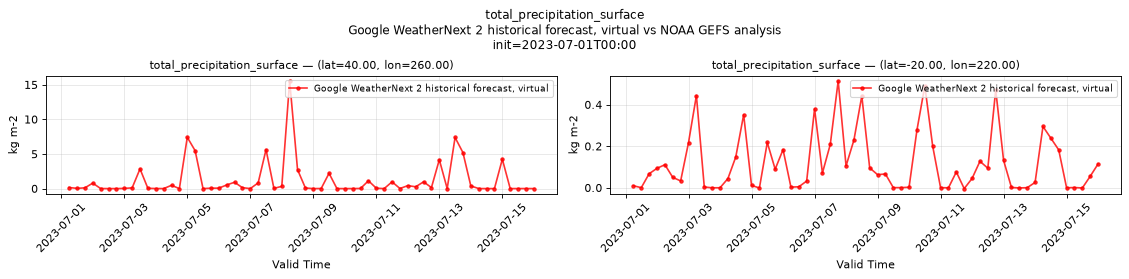
Temporal — init=2023-07-01T00:00
| Source | min | mean | max |
|---|---|---|---|
| P1 Validation | -0.004891 | 1.198 | 15.54 |
| P2 Validation | -0.004249 | 0.1185 | 0.514 |
Availability — 4384 of 4384 positions complete
wind_u_100m
Metadata
| Field | Value |
|---|---|
| units | m s-1 |
| long_name | 100 metre U wind component |
| short_name | 100u |
| standard_name | eastward_wind |
| step_type | instant |
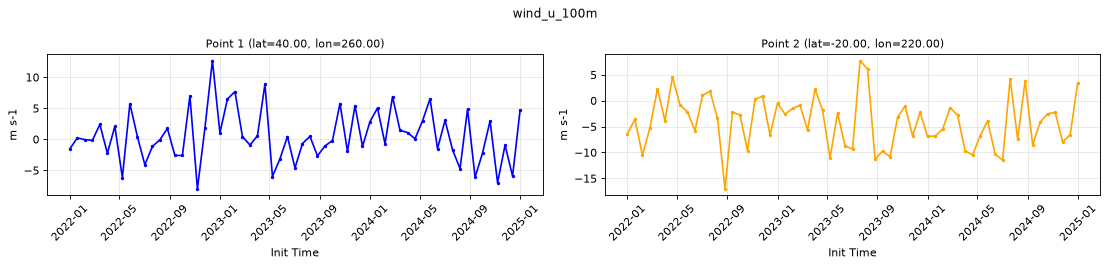
Point time series — 2022-01-01T00:00 - 2024-12-31T18:00, sampled lead=12h, member=0
| Point | min | mean | max |
|---|---|---|---|
| P1 | -7.991 | 0.5212 | 12.69 |
| P2 | -17.01 | -4.046 | 7.725 |
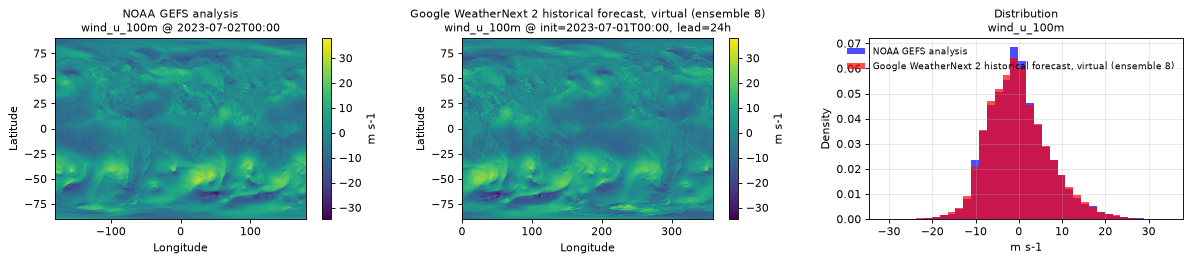
Spatial — init=2023-07-01T00:00, lead=24h (reference at 2023-07-02T00:00)
| Source | min | mean | max |
|---|---|---|---|
| Validation | -34.6 | -0.1183 | 31.45 |
| Reference | -32.5 | -0.07293 | 38 |
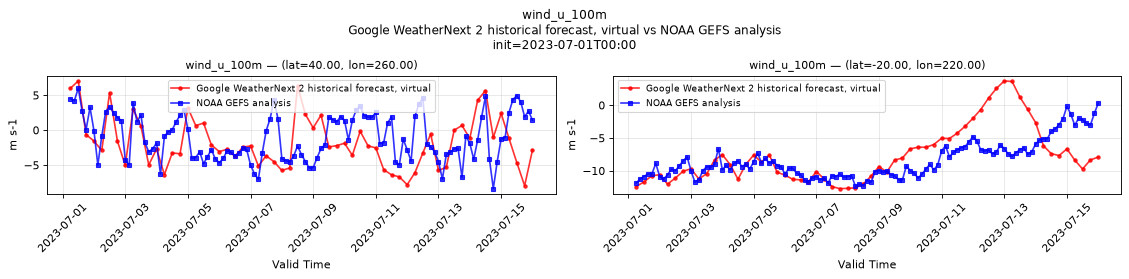
Temporal — init=2023-07-01T00:00
| Source | min | mean | max |
|---|---|---|---|
| P1 Validation | -7.965 | -1.735 | 7.037 |
| P1 Reference | -8.375 | -1.037 | 6 |
| P2 Validation | -12.72 | -7.736 | 3.698 |
| P2 Reference | -12.38 | -8.428 | 0.3047 |
Availability — 4384 of 4384 positions complete
wind_u_10m
Metadata
| Field | Value |
|---|---|
| units | m s-1 |
| long_name | 10 metre U wind component |
| short_name | 10u |
| standard_name | eastward_wind |
| step_type | instant |
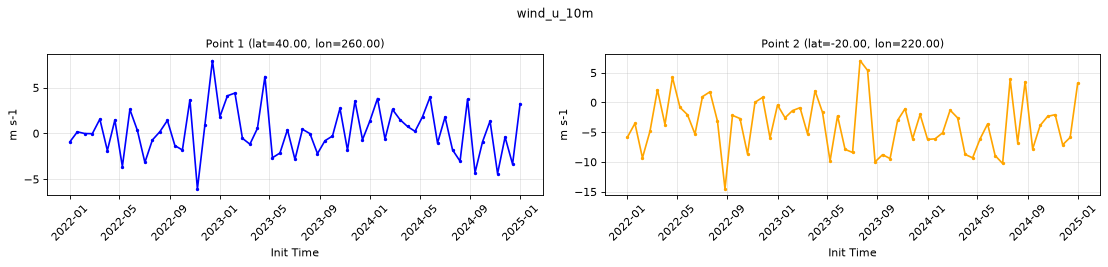
Point time series — 2022-01-01T00:00 - 2024-12-31T18:00, sampled lead=12h, member=0
| Point | min | mean | max |
|---|---|---|---|
| P1 | -6.061 | 0.2628 | 7.954 |
| P2 | -14.52 | -3.646 | 7.045 |
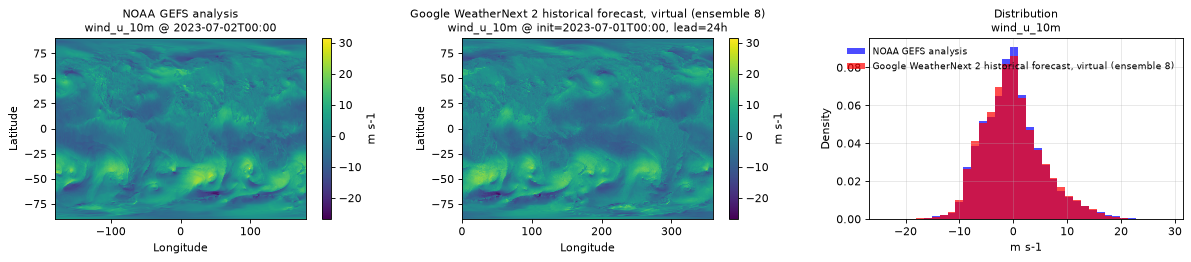
Spatial — init=2023-07-01T00:00, lead=24h (reference at 2023-07-02T00:00)
| Source | min | mean | max |
|---|---|---|---|
| Validation | -26.78 | -0.14 | 25.18 |
| Reference | -25.5 | -0.08615 | 31.5 |
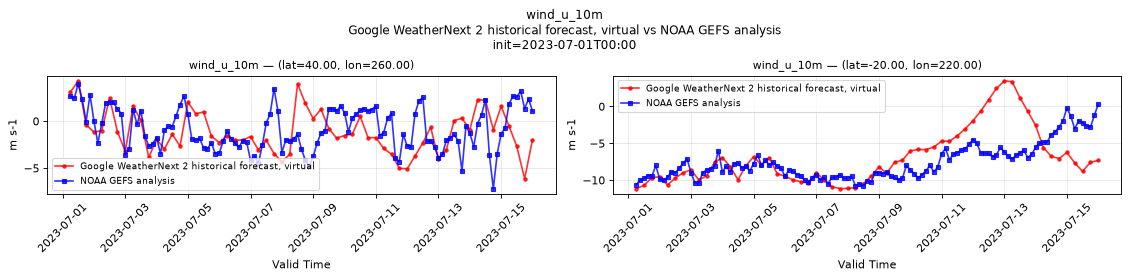
Temporal — init=2023-07-01T00:00
| Source | min | mean | max |
|---|---|---|---|
| P1 Validation | -6.14 | -1.166 | 4.283 |
| P1 Reference | -7.188 | -0.826 | 3.969 |
| P2 Validation | -11.15 | -6.936 | 3.467 |
| P2 Reference | -10.75 | -7.568 | 0.3008 |
Availability — 4384 of 4384 positions complete
wind_v_100m
Metadata
| Field | Value |
|---|---|
| units | m s-1 |
| long_name | 100 metre V wind component |
| short_name | 100v |
| standard_name | northward_wind |
| step_type | instant |
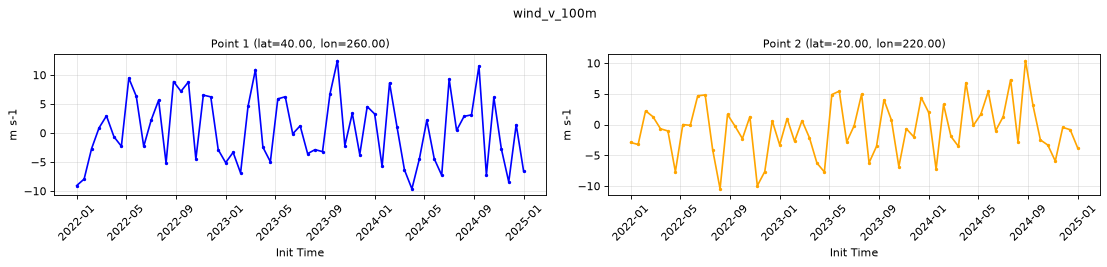
Point time series — 2022-01-01T00:00 - 2024-12-31T18:00, sampled lead=12h, member=0
| Point | min | mean | max |
|---|---|---|---|
| P1 | -9.629 | 0.5271 | 12.48 |
| P2 | -10.47 | -0.7325 | 10.42 |
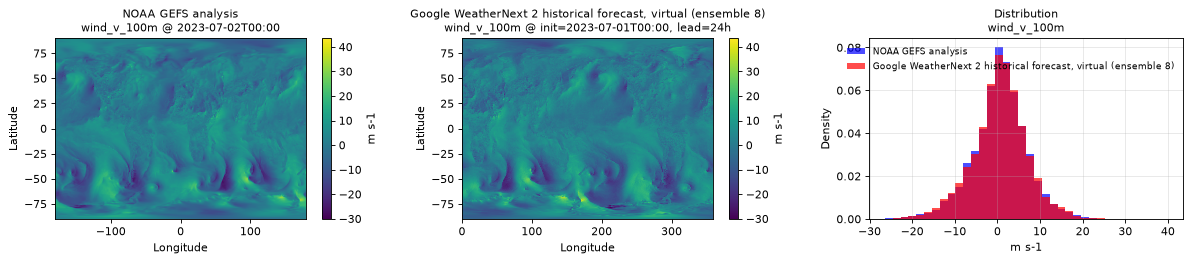
Spatial — init=2023-07-01T00:00, lead=24h (reference at 2023-07-02T00:00)
| Source | min | mean | max |
|---|---|---|---|
| Validation | -30.11 | 0.5833 | 43.59 |
| Reference | -27.75 | 0.5876 | 35.5 |
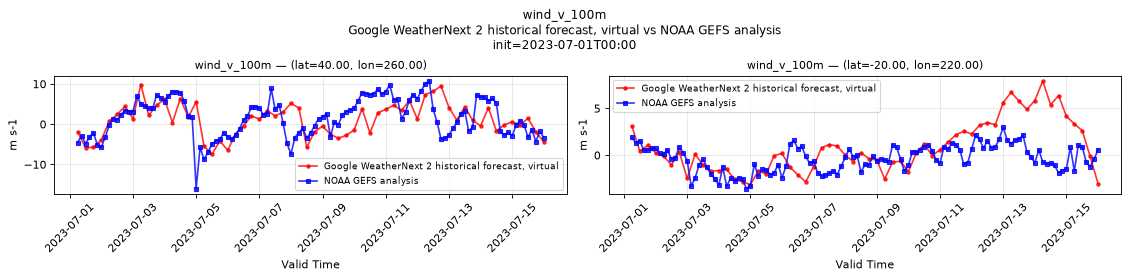
Temporal — init=2023-07-01T00:00
| Source | min | mean | max |
|---|---|---|---|
| P1 Validation | -7.447 | 1.027 | 9.857 |
| P1 Reference | -16 | 1.528 | 10.75 |
| P2 Validation | -3.139 | 0.8008 | 7.923 |
| P2 Reference | -3.562 | -0.3732 | 3 |
Availability — 4384 of 4384 positions complete
wind_v_10m
Metadata
| Field | Value |
|---|---|
| units | m s-1 |
| long_name | 10 metre V wind component |
| short_name | 10v |
| standard_name | northward_wind |
| step_type | instant |
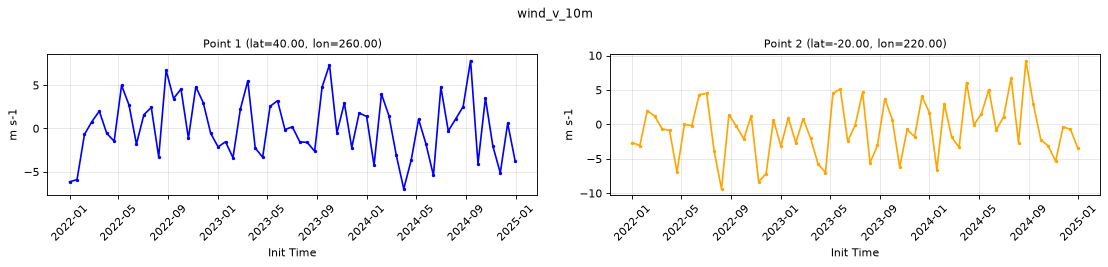
Point time series — 2022-01-01T00:00 - 2024-12-31T18:00, sampled lead=12h, member=0
| Point | min | mean | max |
|---|---|---|---|
| P1 | -6.981 | 0.2009 | 7.839 |
| P2 | -9.371 | -0.6456 | 9.264 |
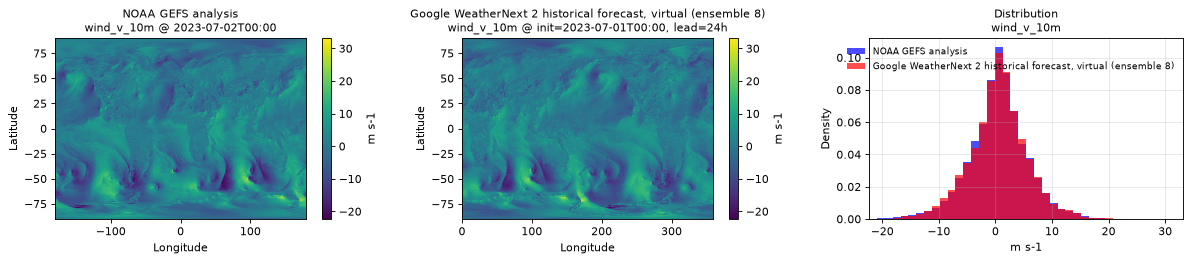
Spatial — init=2023-07-01T00:00, lead=24h (reference at 2023-07-02T00:00)
| Source | min | mean | max |
|---|---|---|---|
| Validation | -22.33 | 0.5581 | 33.19 |
| Reference | -22 | 0.5204 | 27.5 |
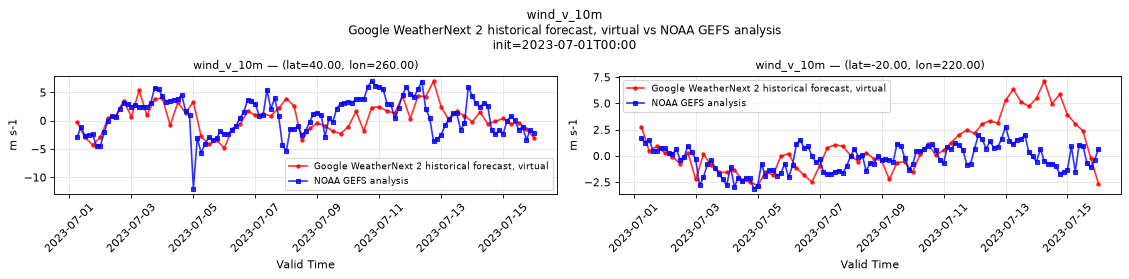
Temporal — init=2023-07-01T00:00
| Source | min | mean | max |
|---|---|---|---|
| P1 Validation | -4.847 | 0.476 | 6.938 |
| P1 Reference | -12 | 0.8335 | 7 |
| P2 Validation | -2.841 | 0.7722 | 7.125 |
| P2 Reference | -3.125 | -0.2548 | 2.781 |
Availability — 4384 of 4384 positions complete