UCSB CHC CHIRPS analysis, final validation report
This dataset validation report plots a sample of values from the UCSB CHC CHIRPS analysis, final dataset over time and across space, comparing where possible to a previously validated reference dataset. It also reports the quantity of unavailable values and their associated timestamps. These analyses are one layer of a multi-layered dataset validation process we perform at dynamical.org and also provide users a preview of the dataset contents.
Report generation start time: 2026-09-15T16:22:06 UTC
Summary
This dataset has been reviewed and is ready for use.
What looks good
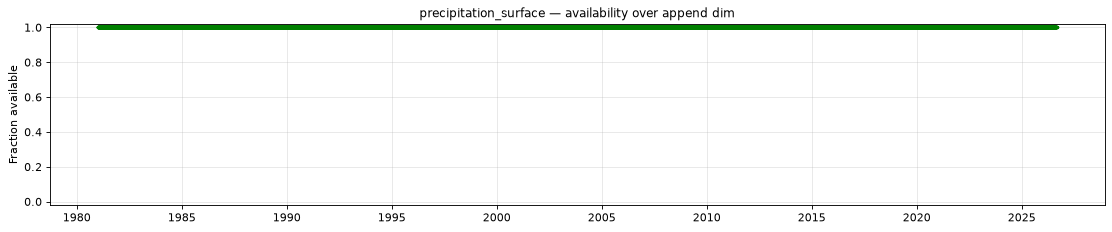
- Every daily position from 1981-01-01 to 2026-08-31 has data, with no gaps anywhere in the 45-year record.
- Coordinates and geometry are correct. Landmark grid cells carry plausible values and the ocean is unestimated where expected; longitude runs −180° to +180° with no seam, and the grid stops at ±59.975° as declared.
- The time coordinate labels the 24-hour window that begins at it. Daily totals from the NOAA GEFS reference track this dataset most closely at zero day offset at five widely separated locations — eastern China, southeastern Australia, South Africa, France and the US Midwest — well clear of the one-day-earlier and one-day-later alternatives.
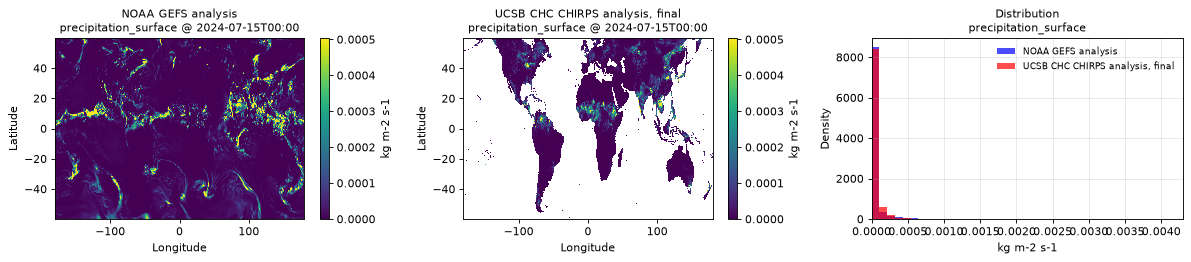
- Units and magnitudes match independent expectations. Global land-average precipitation agrees with the reference to within about 10% on the compared day, and the 1991–2020 averages at both sampled locations — central India and Mato Grosso, Brazil — sit within published climatology for their regions.
- The source's −9999 ocean marker is fully converted to NaN, with no negative or marker-like values left anywhere and the same set of unestimated cells in 1981, 2003 and 2026.
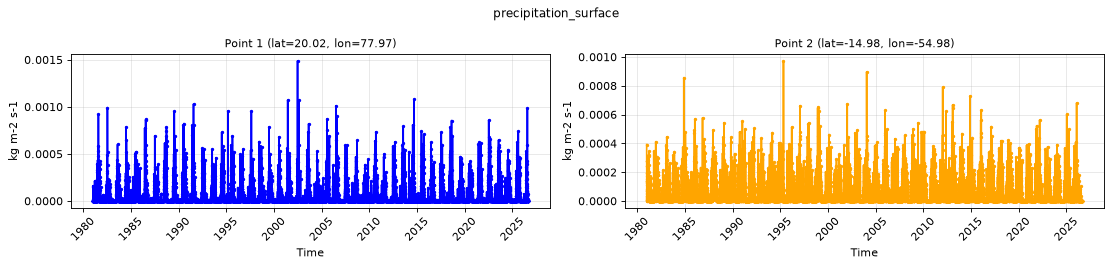
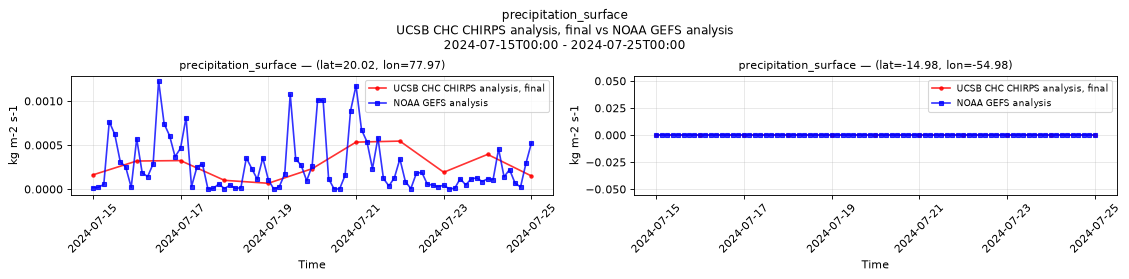
- No drift, step change or quantization across the 45-year record. Daily values at both sampled locations hold a stable seasonal envelope, and stretches of zero rainfall — such as Mato Grosso through the July comparison window — are real dry seasons; the same location in January rains.
Datasets
| Role | Name | ID | Version | URL |
|---|---|---|---|---|
| Validation | UCSB CHC CHIRPS analysis, final | ucsb-chc-chirps-analysis-final |
v0.1.0 |
s3://dynamical-ucsb-chc-chirps/ucsb-chc-chirps-analysis-final/v0.1.0.icechunk |
| Reference | NOAA GEFS analysis | noaa-gefs-analysis |
0.1.2 |
s3://dynamical-noaa-gefs/noaa-gefs-analysis/v0.1.2.icechunk/ |
Run parameters
| Parameter | Value |
|---|---|
| Validation dataset type | analysis |
| Validation time range | time 1981-01-01T00:00 → 2026-08-31T00:00 |
| Reference time range | time 2000-01-01T00:00 → 2026-09-15T12:00 |
| Point 1 | lat=20.0250, lon=77.9750 |
| Point 2 | lat=-14.9750, lon=-54.9750 |
| Spatial comparison time | 2024-07-15T00:00 (reference at 2024-07-15T00:00) |
| Timeseries period | 2024-07-15T00:00 - 2024-07-25T00:00 |
Availability
The plot below shows the availability of each variable over time — light red marks unavailable data, dark green marks present data.
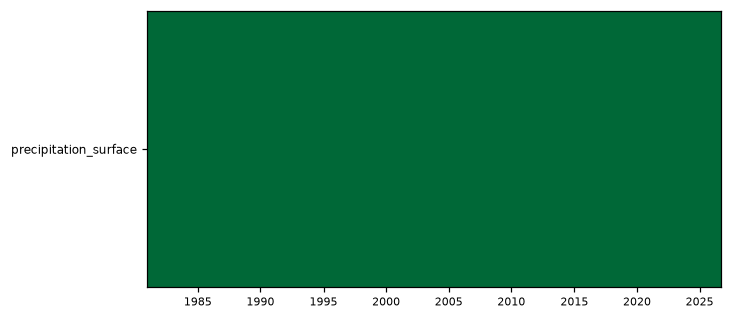
Every variable is complete at every scanned position.
Per-variable details
precipitation_surface
Metadata
| Field | Value |
|---|---|
| units | kg m-2 s-1 |
| long_name | Precipitation rate |
| short_name | prate |
| standard_name | precipitation_flux |
| step_type | avg |
| comment | Average precipitation rate over the 24 hours starting at the time coordinate. Units equivalent to mm/s. NaN over oceans. |
Point time series — 1981-01-01T00:00 - 2026-08-31T00:00
| Point | min | mean | max |
|---|---|---|---|
| P1 | 0 | 3.617e-05 | 0.001488 |
| P2 | 0 | 4.883e-05 | 0.0009727 |
Spatial — 2024-07-15T00:00 (reference at 2024-07-15T00:00)
| Source | min | mean | max |
|---|---|---|---|
| Validation | 0 | 3.464e-05 | 0.004303 |
| Reference | 0 | 3.491e-05 | 0.003525 |
Temporal — 2024-07-15T00:00 - 2024-07-25T00:00
| Source | min | mean | max |
|---|---|---|---|
| P1 Validation | 6.676e-05 | 0.0002745 | 0.0005455 |
| P1 Reference | 0 | 0.0002682 | 0.001228 |
| P2 Validation | 0 | 0 | 0 |
| P2 Reference | 0 | 0 | 0 |
Availability — 16679 of 16679 positions complete