UCSB CHC CHIRPS analysis, preliminary validation report
This dataset validation report plots a sample of values from the UCSB CHC CHIRPS analysis, preliminary dataset over time and across space, comparing where possible to a previously validated reference dataset. It also reports the quantity of unavailable values and their associated timestamps. These analyses are one layer of a multi-layered dataset validation process we perform at dynamical.org and also provide users a preview of the dataset contents.
Report generation start time: 2026-09-15T16:22:34 UTC
Summary
This dataset has been reviewed and is ready for use.
What looks good
- Values match the source files exactly, after the documented conversion from millimetres per day to kilograms per square metre per second.
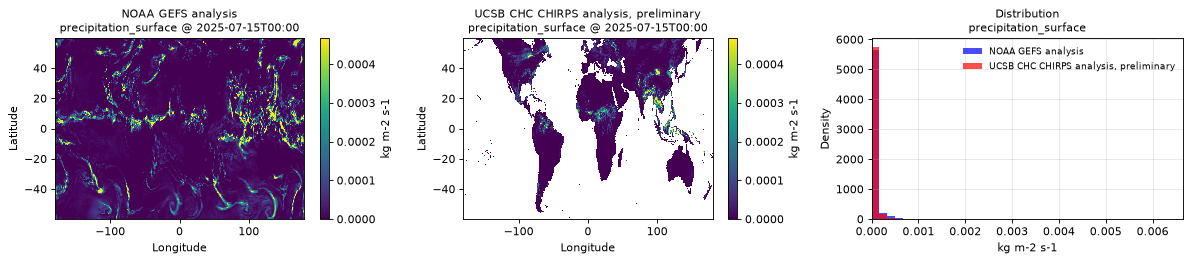
- The grid is correctly aligned — no flipped, shifted, or offset coordinates, confirmed against the source raster and against known land and ocean locations worldwide.
- The land/ocean mask is handled cleanly: the source's no-estimate marker becomes a missing value everywhere it appears and nowhere else, so no placeholder numbers leak into the data.
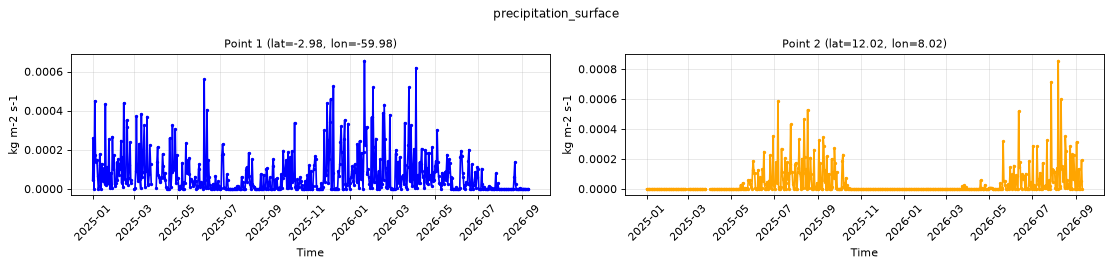
- Seasonal rainfall cycles match regional climatology at both sample locations — the central Amazon's wet season peaking December to May, and northern Nigeria's West African monsoon peaking July to September.
- No drifts, level shifts, or discontinuities across the record, and no visible rounding artifacts.
- Every day in the archive is complete across the whole grid — there are no partially written days.
Review notes
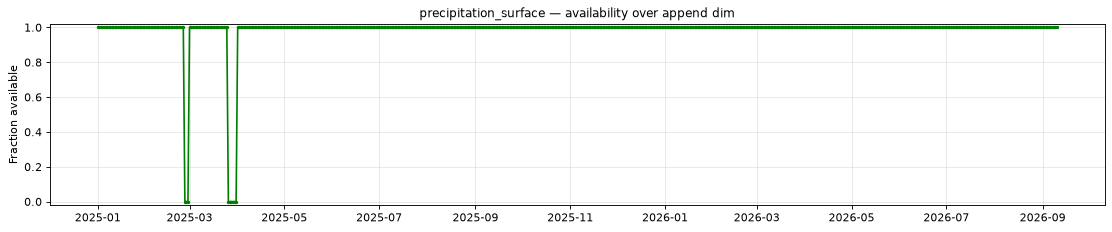
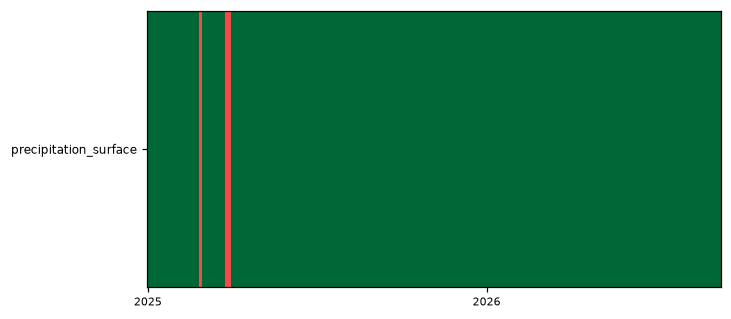
- Two multi-day windows in 2025 contain no data, because the preliminary product was never published for those dates. The CHIRPS final dataset (
ucsb-chc-chirps-analysis-final) covers both windows completely and is the better choice if you need them.- 2025-02-26 – 2025-02-28
- 2025-03-26 – 2025-03-31
Datasets
| Role | Name | ID | Version | URL |
|---|---|---|---|---|
| Validation | UCSB CHC CHIRPS analysis, preliminary | ucsb-chc-chirps-analysis-preliminary |
v0.1.0 |
s3://dynamical-ucsb-chc-chirps/ucsb-chc-chirps-analysis-preliminary/v0.1.0.icechunk |
| Reference | NOAA GEFS analysis | noaa-gefs-analysis |
0.1.2 |
s3://dynamical-noaa-gefs/noaa-gefs-analysis/v0.1.2.icechunk/ |
Run parameters
| Parameter | Value |
|---|---|
| Validation dataset type | analysis |
| Validation time range | time 2025-01-01T00:00 → 2026-09-10T00:00 |
| Reference time range | time 2000-01-01T00:00 → 2026-09-15T12:00 |
| Point 1 | lat=-2.9750, lon=-59.9750 |
| Point 2 | lat=12.0250, lon=8.0250 |
| Spatial comparison time | 2025-07-15T00:00 (reference at 2025-07-15T00:00) |
| Timeseries period | 2025-07-15T00:00 - 2025-07-25T00:00 |
Availability
The plot below shows the availability of each variable over time — light red marks unavailable data, dark green marks present data.
| Variable | Complete positions | Incomplete % | First incomplete | Last incomplete |
|---|---|---|---|---|
precipitation_surface |
609/618 | 1.46% | 2025-02-26T00:00 | 2025-03-31T00:00 |
- Unavailable timestamps:
unavailable_timestamps.txt
Per-variable details
precipitation_surface
Metadata
| Field | Value |
|---|---|
| units | kg m-2 s-1 |
| long_name | Precipitation rate |
| short_name | prate |
| standard_name | precipitation_flux |
| step_type | avg |
| comment | Average precipitation rate over the 24 hours starting at the time coordinate. Units equivalent to mm/s. NaN over oceans. |
Point time series — 2025-01-01T00:00 - 2026-09-10T00:00
| Point | min | mean | max |
|---|---|---|---|
| P1 | 0 | 7.258e-05 | 0.0006561 |
| P2 | 0 | 3.656e-05 | 0.0008564 |
Spatial — 2025-07-15T00:00 (reference at 2025-07-15T00:00)
| Source | min | mean | max |
|---|---|---|---|
| Validation | 0 | 2.685e-05 | 0.00309 |
| Reference | 0 | 3.524e-05 | 0.006653 |
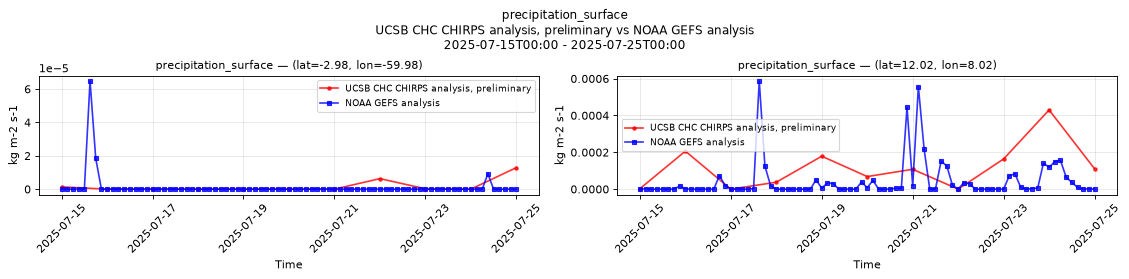
Temporal — 2025-07-15T00:00 - 2025-07-25T00:00
| Source | min | mean | max |
|---|---|---|---|
| P1 Validation | 0 | 1.885e-06 | 1.287e-05 |
| P1 Reference | 0 | 1.143e-06 | 6.485e-05 |
| P2 Validation | 0 | 0.0001187 | 0.0004301 |
| P2 Reference | 0 | 4.354e-05 | 0.0005875 |
Availability — 609 of 618 positions complete (incomplete 2025-02-26T00:00 → 2025-03-31T00:00); nulls P1 9/618, P2 9/618 (scanned from this variable's own values; a semantic missing value at a run point is indistinguishable from unavailable data)